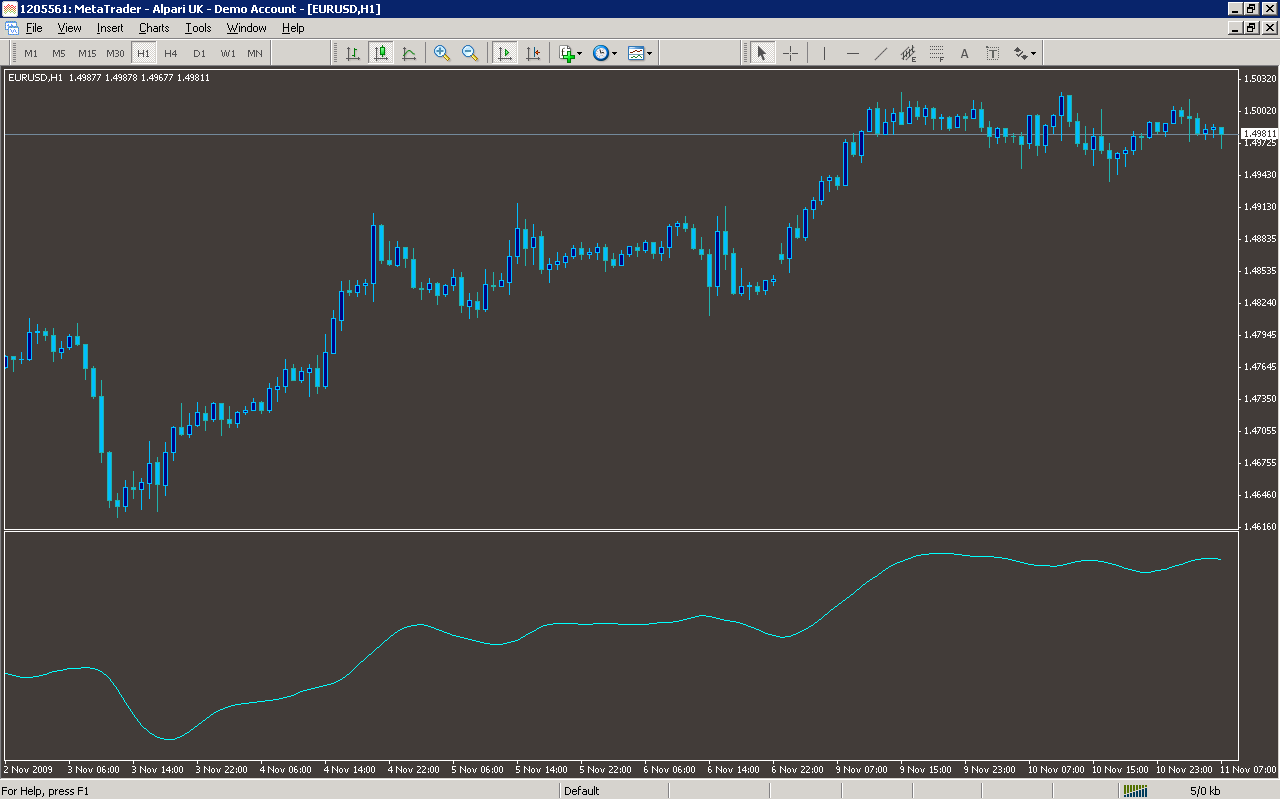
//+------------------------------------------------------------------+
//|                                     TwoPoleButterworthFilter.mq4 |
//|                                                                  |
//| Two-Pole Butterworth Filter                                      |
//|                                                                  |
//| Algorithm taken from book                                        |
//|     "Cybernetics Analysis for Stock and Futures"                 |
//| by John F. Ehlers                                                |
//|                                                                  |
//|                                              contact@mqlsoft.com |
//|                                          http://www.mqlsoft.com/ |
//+------------------------------------------------------------------+
#property copyright "Coded by Witold Wozniak"
#property link      "www.mqlsoft.com"

#property indicator_chart_window
#property indicator_buffers 1
#property indicator_color1 Red

extern int CutoffPeriod = 15;

double Filter[];

int buffers = 0;
int drawBegin = 0;

double tempReal, rad2Deg, deg2Rad;
double coef1, coef2, coef3;

int init() {
    drawBegin = 4;
    initBuffer(Filter, "Two-Pole Butterworth Filter", DRAW_LINE);
    IndicatorBuffers(buffers);
    IndicatorShortName("Two-Pole Butterworth Filter [" + CutoffPeriod + "]");
    tempReal = MathArctan(1.0);
    rad2Deg = 45.0 / tempReal;
    deg2Rad = 1.0 / rad2Deg;
    double a1 = MathExp(-1.414 * 3.14159 / CutoffPeriod);
    double b1 = 2 * a1 * MathCos(deg2Rad * 1.414 * 180 / CutoffPeriod);
    coef2 = b1;
    coef3 = -a1 * a1;
    coef1 = (1.0 - b1 + a1 * a1) / 4.0;
    return (0);
}

int start() {
    if (Bars <= drawBegin) return (0);
    int countedBars = IndicatorCounted();
    if (countedBars < 0) return (-1);
    if (countedBars > 0) countedBars--;
    int s, limit = Bars - countedBars - 1;
    for (s = limit; s >= 0; s--) {
        Filter[s] = coef1 * (P(s) + 2.0 * P(s + 1) + P(s + 2)) +
                    coef2 * Filter[s + 1] +
                    coef3 * Filter[s + 2];
        if (s > Bars - 4) {
            Filter[s] = P(s);
        }
    }
    return (0);
}

double P(int index) {
    return ((High[index] + Low[index]) / 2.0);
}

void initBuffer(double array[], string label = "", int type = DRAW_NONE, int arrow = 0, int style = EMPTY, int width = EMPTY, color clr = CLR_NONE) {
    SetIndexBuffer(buffers, array);
    SetIndexLabel(buffers, label);
    SetIndexEmptyValue(buffers, EMPTY_VALUE);
    SetIndexDrawBegin(buffers, drawBegin);
    SetIndexShift(buffers, 0);
    SetIndexStyle(buffers, type, style, width);
    SetIndexArrow(buffers, arrow);
    buffers++;
}
Sample
Analysis
Market Information Used:
Series array that contains the highest prices of each bar
Series array that contains the lowest prices of each bar
Indicator Curves created:
Implements a curve of type type
Indicators Used:
Custom Indicators Used:
Order Management characteristics:
Other Features:
