//+------------------------------------------------------------------+
//|                                                 LabTrend2_v1.mq4 |
//|                                  Copyright © 2006, Forex-TSD.com |
//|                         Written by IgorAD,igorad2003@yahoo.co.uk |
//|            http://finance.groups.yahoo.com/group/TrendLaboratory |
//+------------------------------------------------------------------+
#property copyright "Copyright © 2006, Forex-TSD.com "
#property link      "http://www.forex-tsd.com/"

#property indicator_chart_window
#property indicator_buffers 2
#property indicator_color1 Chartreuse
#property indicator_color2 Orange
//---- input parameters

extern int    Risk=3;         // Sensivity Factor
extern double MoneyRisk=2.00; // Offset Factor
extern int    BarsNumber=1000;
//---- indicator buffers
double UpTrendBuffer[];
double DownTrendBuffer[];

//+------------------------------------------------------------------+
//| Custom indicator initialization function                         |
//+------------------------------------------------------------------+
  int init()
  {
   string short_name;
//---- indicator line

   SetIndexBuffer(0,UpTrendBuffer);
   SetIndexBuffer(1,DownTrendBuffer);

   SetIndexStyle(0,DRAW_ARROW);
   SetIndexStyle(1,DRAW_ARROW);

   SetIndexArrow(0,159);
   SetIndexArrow(1,159);

   IndicatorDigits(MarketInfo(Symbol(),MODE_DIGITS));
//---- name for DataWindow and indicator subwindow label
   short_name="LabTrend2("+Risk+","+MoneyRisk+")";
   IndicatorShortName(short_name);
   SetIndexLabel(0,"UpTrend Stop");
   SetIndexLabel(1,"DownTrend Stop");
//----
   SetIndexDrawBegin(0,10);
   SetIndexDrawBegin(1,10);
   SetIndexDrawBegin(2,10);
   SetIndexDrawBegin(3,10);
   SetIndexDrawBegin(4,10);
   SetIndexDrawBegin(5,10);
//----
   return(0);
  }

//+------------------------------------------------------------------+
//| LabTrend2_v1                                             |
//+------------------------------------------------------------------+
int start()
  {
   int    i,shift,trend;
   double smax[25000],smin[25000];

   int Nbars=BarsNumber+100;
   int    Length=10;      // Volatility(ATR) Period
   double delta=MathAbs(Bid-Ask)/Point;
   //double delta=3;
   for (shift=Nbars;shift>=0;shift--)
   {
   UpTrendBuffer[shift]=0;
   DownTrendBuffer[shift]=0;
   }

   for (shift=Nbars-Length-101;shift>=0;shift--)
   {
     double Range=iATR(NULL,0,Length,shift);
     double sum=0;
     for (i=1;i<=100;i++) sum+=iATR(NULL,0,Length,shift+i);
     double AvgRange=sum/100.0;
     if (Range<AvgRange) Range=AvgRange;

     smax[shift]=High[shift]+(1.5+0.1*Risk)*Range;
	  smin[shift]=Low[shift]-(1.5+0.1*Risk)*Range;

	  double sma1=iMA(NULL,0,9,0,MODE_SMA,PRICE_CLOSE,shift);
	  double sma2=iMA(NULL,0,18+3*Risk,0,MODE_SMA,PRICE_CLOSE,shift);

	  if (sma1-sma2>delta*Point) trend=1;
	  if (sma2-sma1>delta*Point) trend=-1;

	  if(trend>0)
	  {
	  if(Low[shift]-smin[shift]<MoneyRisk*Range) smin[shift]=Low[shift]-MoneyRisk*Range;
	  if(smin[shift]<smin[shift+1]) smin[shift]=smin[shift+1];
	  }

	  if(trend<0)
	  {
	  if(smax[shift]-High[shift]<MoneyRisk*Range) smax[shift]=High[shift]+MoneyRisk*Range;
	  if(smax[shift]>smax[shift+1]) smax[shift]=smax[shift+1];
	  }

	  if (trend>0)
	  {
	     if (UpTrendBuffer[shift+1]==-1.0)
	     {
	     smin[shift]=Low[shift]-Range;
	     UpTrendBuffer[shift]=smin[shift];
	     }
	     else
	     {
	     UpTrendBuffer[shift]=smin[shift];
	     }
	  DownTrendBuffer[shift]=-1.0;
	  }
	  if (trend<0)
	  {
	  if (DownTrendBuffer[shift+1]==-1.0)
	     {
	     smax[shift]=High[shift]+Range;
	     DownTrendBuffer[shift]=smax[shift];
	     }
	     else
	     {
	     DownTrendBuffer[shift]=smax[shift];
	     }
	  UpTrendBuffer[shift]=-1.0;
	  }

	 }
	return(0);
 }
Sample
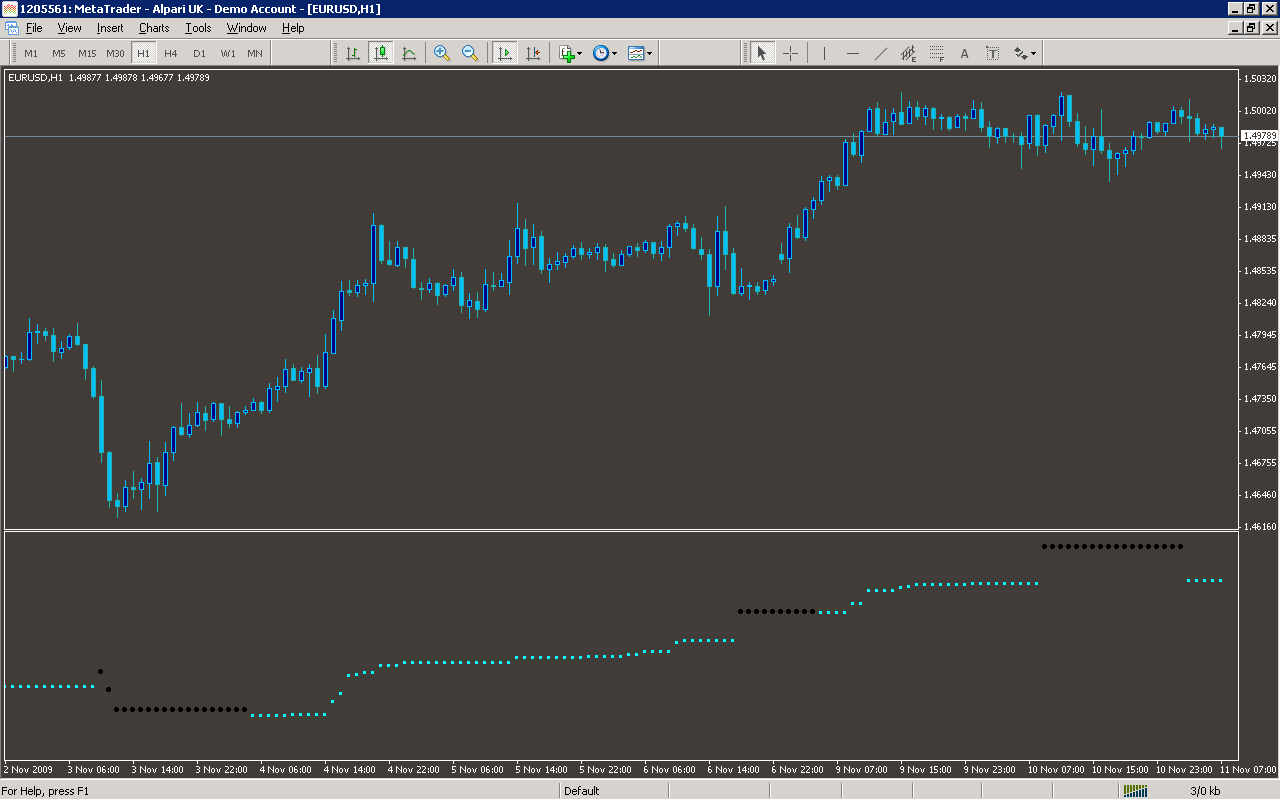
Analysis
Market Information Used:
Series array that contains the highest prices of each bar
Series array that contains the lowest prices of each bar
Indicator Curves created:
Implements a curve of type DRAW_ARROW
Indicators Used:
Indicator of the average true range
Moving average indicator
Custom Indicators Used:
Order Management characteristics:
Other Features: