//+------------------------------------------------------------------+
//|                                                 LabTrend3_v1.mq4 |
//|                                  Copyright © 2006, Forex-TSD.com |
//|                         Written by IgorAD,igorad2003@yahoo.co.uk |
//|            http://finance.groups.yahoo.com/group/TrendLaboratory |
//+------------------------------------------------------------------+
#property copyright "Copyright © 2006, Forex-TSD.com "
#property link      "http://www.forex-tsd.com/"

#property indicator_chart_window
#property indicator_buffers 2
#property indicator_color1 Aqua
#property indicator_color2 Magenta
//---- input parameters

extern int    Risk=3;         // Sensivity Factor
extern double MoneyRisk=2.0; // Offset Factor
extern int    BarsNumber=1000;
//---- indicator buffers
double UpTrendBuffer[];
double DownTrendBuffer[];

//+------------------------------------------------------------------+
//| Custom indicator initialization function                         |
//+------------------------------------------------------------------+
  int init()
  {
   string short_name;
//---- indicator line

   SetIndexBuffer(0,UpTrendBuffer);
   SetIndexBuffer(1,DownTrendBuffer);

   SetIndexStyle(0,DRAW_ARROW);
   SetIndexStyle(1,DRAW_ARROW);

   SetIndexArrow(0,159);
   SetIndexArrow(1,159);

   IndicatorDigits(MarketInfo(Symbol(),MODE_DIGITS));
//---- name for DataWindow and indicator subwindow label
   short_name="LabTrend3("+Risk+","+MoneyRisk+")";
   IndicatorShortName(short_name);
   SetIndexLabel(0,"UpTrend Stop");
   SetIndexLabel(1,"DownTrend Stop");
//----
   SetIndexDrawBegin(0,10);
   SetIndexDrawBegin(1,10);
   SetIndexDrawBegin(2,10);
   SetIndexDrawBegin(3,10);
   SetIndexDrawBegin(4,10);
   SetIndexDrawBegin(5,10);
//----
   return(0);
  }

//+------------------------------------------------------------------+
//| LabTrend3_v1                                             |
//+------------------------------------------------------------------+
int start()
  {
   int    i,shift,trend;
   double Kv=0.382,smax[25000],smin[25000],bsmax[25000],bsmin[25000];

   int    Length=10;      // Volatility(ATR) Period
   int Nbars=BarsNumber+100;

   for (shift=Nbars;shift>=0;shift--)
   {
   UpTrendBuffer[shift]=0;
   DownTrendBuffer[shift]=0;
   }

   for (shift=Nbars-Length-100;shift>=0;shift--)
   {
     double Range=iATR(NULL,0,Length,shift);
     double AvgRange=iATR(NULL,0,100,shift);

     if (Range<AvgRange) Range=AvgRange;

     double high=High[Highest(NULL,0,MODE_HIGH,9,shift)];
     double low =Low[Lowest(NULL,0,MODE_LOW,9,shift)];

     smin[shift]=low + 0.3*(high-low);
     smax[shift]=high- 0.3*(high-low);

     bsmax[shift]=High[shift]+(1.0+0.1*Risk)*Range;
	  bsmin[shift]=Low[shift]-(1.0+0.1*Risk)*Range;

	  if(Close[shift]>smax[shift])  trend=1;
     if(Close[shift]<smin[shift])  trend=-1;

	  if(trend>0)
	  {
	  if(Low[shift]-bsmin[shift]<Kv*MoneyRisk*Range) bsmin[shift]=Low[shift]-Kv*MoneyRisk*Range;
	  if(bsmin[shift]<bsmin[shift+1]) bsmin[shift]=bsmin[shift+1];
	  }

	  if(trend<0)
	  {
	  if(bsmax[shift]-High[shift]<Kv*MoneyRisk*Range) bsmax[shift]=High[shift]+Kv*MoneyRisk*Range;
	  if(bsmax[shift]>bsmax[shift+1]) bsmax[shift]=bsmax[shift+1];
	  }

	  if (trend>0)
	  {
	     if (UpTrendBuffer[shift+1]==-1.0)
	     {
	     bsmin[shift]=Low[shift]-0.1*Risk*Range;
	     UpTrendBuffer[shift]=bsmin[shift];
	     }
	     else
	     {
	     UpTrendBuffer[shift]=bsmin[shift];
	     }
	  DownTrendBuffer[shift]=-1.0;
	  }
	  if (trend<0)
	  {
	  if (DownTrendBuffer[shift+1]==-1.0)
	     {
	     bsmax[shift]=High[shift]+0.1*Risk*Range;
	     DownTrendBuffer[shift]=bsmax[shift];
	     }
	     else
	     {
	     DownTrendBuffer[shift]=bsmax[shift];
	     }
	  UpTrendBuffer[shift]=-1.0;
	  }

	 }
	return(0);
 }
Sample
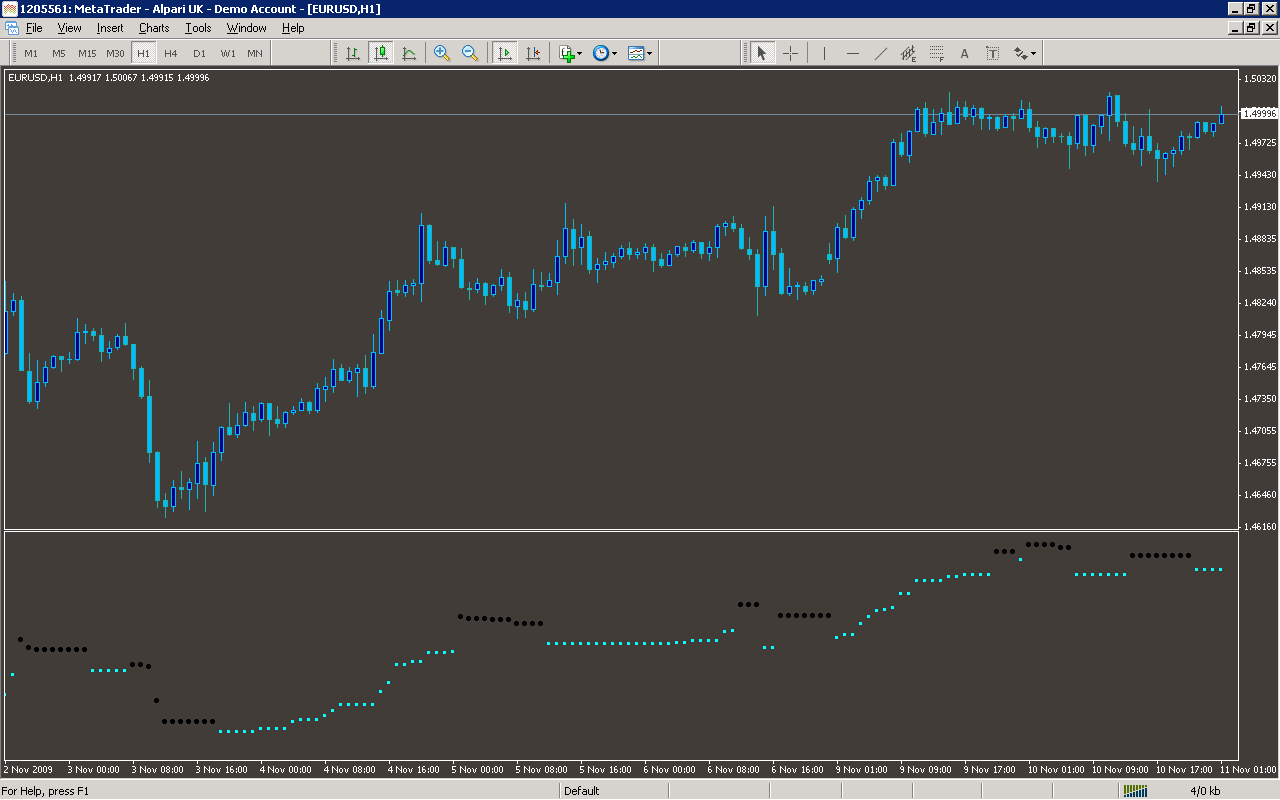
Analysis
Market Information Used:
Series array that contains the highest prices of each bar
Series array that contains the lowest prices of each bar
Series array that contains close prices for each bar
Indicator Curves created:
Implements a curve of type DRAW_ARROW
Indicators Used:
Indicator of the average true range
Custom Indicators Used:
Order Management characteristics:
Other Features: