#property indicator_chart_window
#property indicator_buffers 3
#property indicator_color1 Green
#property indicator_color2 Green
#property indicator_color3 Green

//----------------------------------
extern int iPeriod=14;
extern double StdFrrors=2;
//----------------------------------
double ci[],uch[],dch[];
double L_Value, M_Dev;
//================================================
int init(){

   SetIndexStyle(0,DRAW_LINE);
   SetIndexBuffer(0,ci);

   SetIndexStyle(1,DRAW_LINE);
   SetIndexBuffer(1,uch);

   SetIndexStyle(2,DRAW_LINE);
   SetIndexBuffer(2,dch);

   return(0);}
//================================================

int start(){
   int limit;
	int counted_bars=IndicatorCounted(); // îïðåäåëèì êîëè÷åñòâî ïðîñ÷èòàíûõ áàðîâ ó èíäèêàòîðà
	  if(counted_bars>0){
	     counted_bars--;
	  }
	limit=Bars-counted_bars;

	for(int i=0;i<limit;i++){
	  LR_Close(i,i+iPeriod);
	  ci[i]=L_Value;
	  uch[i]=L_Value+StdFrrors*M_Dev;
	  dch[i]=L_Value-StdFrrors*M_Dev;
	}
 return(0);
}
//+------------------------------------------------------------------+
void LR_Close(int i0,int i1){
  int m_pos[2];
  m_pos[0]=i0;
  m_pos[1]=i1;
  double m_value[2];
   int n=m_pos[1]-m_pos[0]+1;
//---- calculate price values
   double value=Close[m_pos[0]];
   double a,b,c;
   double sumy=value;
   double sumx=0.0;
   double sumxy=0.0;
   double sumx2=0.0;
   for(int i=1; i<n; i++)
     {
      value=Close[m_pos[0]+i];
      sumy+=value;
      sumxy+=value*i;
      sumx+=i;
      sumx2+=i*i;

     }
   c=sumx2*n-sumx*sumx;
   if(c==0.0) return;
   b=(sumxy*n-sumx*sumy)/c;
   a=(sumy-sumx*b)/n;
   m_value[0]=a;
   m_value[1]=a+b*n;

//---- maximal deviation
   double maxdev=0;
   double deviation=0;
   double dvalue=a;
   for(i=0; i<n; i++)
     {
      value=Close[m_pos[0]+i];
      dvalue+=b;
      deviation=MathAbs(value-dvalue);
      if(maxdev<=deviation) maxdev=deviation;
     }
   L_Value=m_value[0];
   M_Dev=maxdev;
  }
Sample
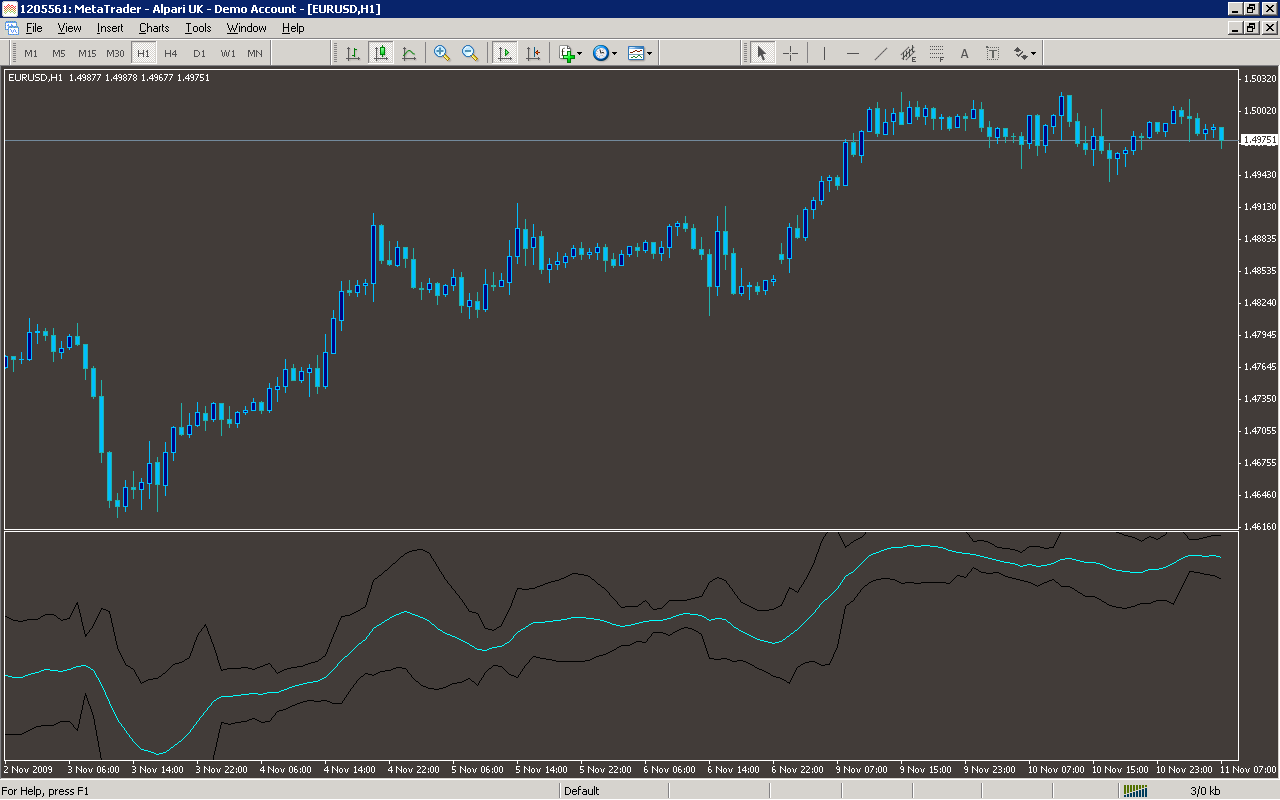
Analysis
Market Information Used:
Series array that contains close prices for each bar
Indicator Curves created:
Implements a curve of type DRAW_LINE
Indicators Used:
Custom Indicators Used:
Order Management characteristics:
Other Features: