//+------------------------------------------------------------------+
//|                                              #MTF_HULL_TREND.mq4 |
//|------------------------------------------------------------------+

#property indicator_chart_window
#property indicator_buffers 4
#property indicator_color1 LightBlue
#property indicator_color2 MistyRose
#property indicator_width1 2
#property indicator_width2 2
#property indicator_color3 Yellow
#property indicator_color4 Magenta
#property indicator_width3 5
#property indicator_width4 5
//---- input parameters
/*************************************************************************
PERIOD_M1   1
PERIOD_M5   5
PERIOD_M15  15
PERIOD_M30  30
PERIOD_H1   60
PERIOD_H4   240
PERIOD_D1   1440
PERIOD_W1   10080
PERIOD_MN1  43200
You must use the numeric value of the timeframe that you want to use
when you set the TimeFrame' value with the indicator inputs.
---------------------------------------*/

extern int    TimeFrame = 0;
double UpBuffer[];
double DnBuffer[];
double UpSignal[];
double DnSignal[];
double smax[];
double smin[];
double trend[];
extern int     MA_Period      = 14;
extern int     MA_Shift       =  0;
extern int     MA_Method      =  3;
extern int     Applied_Price  =  0;
extern double  Deviation      =0.1;//was 0.2
extern int     UseSignal      =  1;

//+------------------------------------------------------------------+
//| Custom indicator initialization function                         |
//+------------------------------------------------------------------+

int init()
  {
   int    draw_begin;
   string short_name;
//---- drawing settings
   IndicatorBuffers(7);
   SetIndexStyle(0,DRAW_LINE);
   SetIndexShift(0,MA_Shift);
   SetIndexStyle(1,DRAW_LINE);
   SetIndexShift(1,MA_Shift);

   SetIndexStyle(2,DRAW_ARROW);
   SetIndexShift(2,MA_Shift);
   SetIndexArrow(2,233);
   SetIndexStyle(3,DRAW_ARROW);
   SetIndexShift(3,MA_Shift);
   SetIndexArrow(3,234);

   IndicatorDigits(MarketInfo(Symbol(),MODE_DIGITS));
   if(MA_Period<2) MA_Period=14;
   draw_begin=MA_Period-1;
//---- indicator short name
   IndicatorShortName("Env("+MA_Period+")");
   SetIndexLabel(0,"UpTrendEnv");
   SetIndexLabel(1,"DnTrendEnv");
   SetIndexLabel(2,"UpSignal");
   SetIndexLabel(3,"DnSignal");
   SetIndexDrawBegin(0,draw_begin);
   SetIndexDrawBegin(1,draw_begin);
   SetIndexDrawBegin(2,draw_begin);
   SetIndexDrawBegin(3,draw_begin);
   //---- indicator buffers mapping
   SetIndexBuffer(0,UpBuffer);
   SetIndexBuffer(1,DnBuffer);
   SetIndexBuffer(2,UpSignal);
   SetIndexBuffer(3,DnSignal);
   SetIndexBuffer(4,smax);
   SetIndexBuffer(5,smin);
   SetIndexBuffer(6,trend);
   if(Deviation<0.1) Deviation=0.1;
   if(Deviation>100.0) Deviation=100.0;
//---- initialization done
   return(0);
//---- name for DataWindow and indicator subwindow label

   switch(TimeFrame)
   {
      case 1 : string TimeFrameStr="Period_M1"; break;
      case 5 : TimeFrameStr="Period_M5"; break;
      case 15 : TimeFrameStr="Period_M15"; break;
      case 30 : TimeFrameStr="Period_M30"; break;
      case 60 : TimeFrameStr="Period_H1"; break;
      case 240 : TimeFrameStr="Period_H4"; break;
      case 1440 : TimeFrameStr="Period_D1"; break;
      case 10080 : TimeFrameStr="Period_W1"; break;
      case 43200 : TimeFrameStr="Period_MN1"; break;
      default : TimeFrameStr="Current Timeframe";
   }
   IndicatorShortName("#MTF_TrendEnvelopes_v1("+TimeFrameStr+")");

  }

//----

   return(0);

//+------------------------------------------------------------------+
//|                                                                  |
//+------------------------------------------------------------------+

int start()
  {

   datetime TimeArray[];
   int    i,limit,y=0,counted_bars=IndicatorCounted();

// Plot defined time frame on to current time frame

   ArrayCopySeries(TimeArray,MODE_TIME,Symbol(),TimeFrame);

   limit= Bars-1;
   for(i=0,y=0;i<limit;i++)
   {
   if (Time[i]<TimeArray[y]) y++;

/***********************************************************
   Add your main indicator loop below.  You can reference an existing
      indicator with its iName  or iCustom.
   Rule 1:  Add extern inputs above for all neccesary values
   Rule 2:  Use 'TimeFrame' for the indicator time frame
   Rule 3:  Use 'y' for your indicator's shift value
 **********************************************************/

 UpBuffer[i]=iCustom(Symbol(),TimeFrame,"TrendEnvelopes_v2-1",0,y);
  DnBuffer[i]=iCustom(Symbol(),TimeFrame,"TrendEnvelopes_v2-1",1,y);
  if (Time[i]==TimeArray[y]) UpSignal[i]=iCustom(Symbol(),TimeFrame,"TrendEnvelopes_v2-1",2,y);
  if (Time[i]==TimeArray[y]) DnSignal[i]=iCustom(Symbol(),TimeFrame,"TrendEnvelopes_v2-1",3,y);
   }
   return(0);
  }
//+------------------------------------------------------------------+
Sample
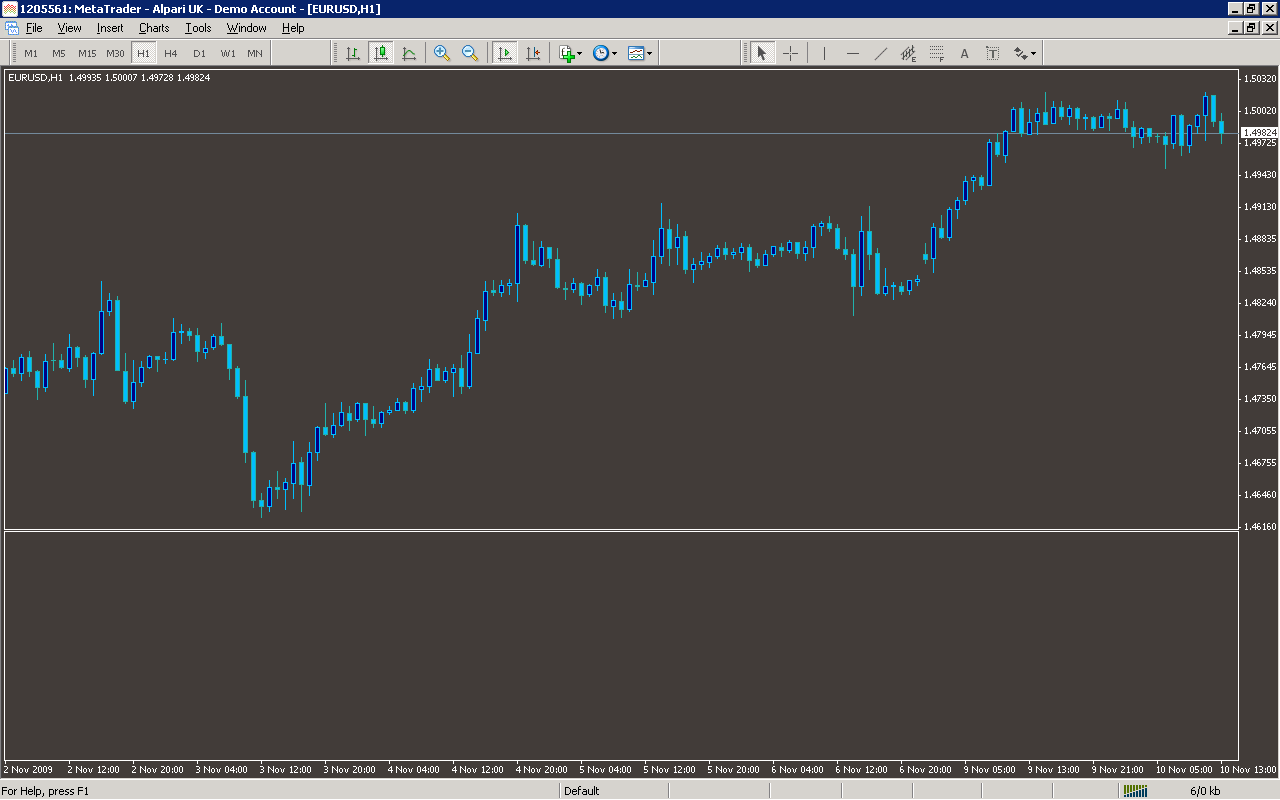
Analysis
Market Information Used:
Series array that contains open time of each bar
Indicator Curves created:
Implements a curve of type DRAW_LINE
Implements a curve of type DRAW_ARROW
Indicators Used:
Custom Indicators Used:
TrendEnvelopes_v2-1
Order Management characteristics:
Other Features: