//+------------------------------------------------------------------+
//| EMA-Crossover_Signal.mq4 |
//| |
//+------------------------------------------------------------------+
/*
+------------------------------------------------------------------+
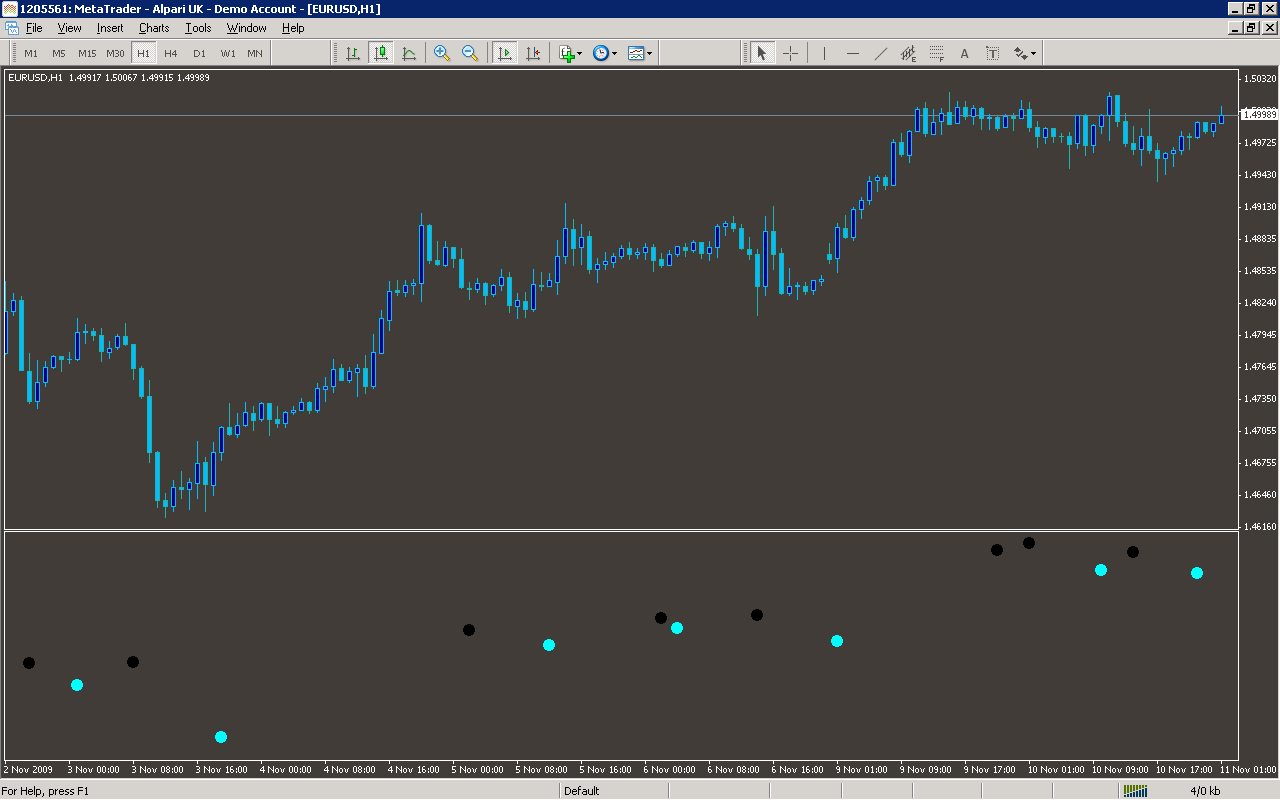
| Allows you to enter two ema periods and it will then show you at |
| Which point they crossed over. It is more usful on the shorter |
| periods that get obscured by the bars / candlesticks and when |
| the zoom level is out. Also allows you then to remove the emas |
| from the chart.
+------------------------------------------------------------------+
*/
#property indicator_chart_window
#property indicator_buffers 2
#property indicator_color1 Yellow
#property indicator_color2 Red
double CrossUp[];
double CrossDown[];
int CurrentTrend = 0;
int starttime = 0;
extern int FasterMAperiod = 5;
extern int FasterMAtype = 3;
extern int SlowerMAperiod = 13;
extern int SlowerMAtype = 3;
extern int Show_Alert = 1;
extern int Play_Sound = 1;
extern int Send_Mail = 0;
extern string SoundFilename = "alert.wav";
int init()
{
SetIndexStyle(0, DRAW_ARROW, EMPTY,2);
SetIndexArrow(0, 108);
SetIndexBuffer(0, CrossUp);
SetIndexStyle(1, DRAW_ARROW, EMPTY,2);
SetIndexArrow(1, 108);
SetIndexBuffer(1, CrossDown);
starttime = TimeLocal();
return(0);
}
int deinit()
{
return(0);
}
int start() {
int limit, i, counter, loop;
double fasterEMAnow, slowerEMAnow, fasterEMAprevious, slowerEMAprevious, fasterEMAafter, slowerEMAafter;
double Range, AvgRange;
int counted_bars=IndicatorCounted();
//---- check for possible errors
if(counted_bars<0) return(-1);
//---- last counted bar will be recounted
if(counted_bars>0) counted_bars--;
limit=Bars-counted_bars;
loop = 0;
for(i = 0; i <= limit; i++) {
counter=i;
Range=0;
AvgRange=0;
for (counter=i ;counter<=i+9;counter++)
{
AvgRange=AvgRange+MathAbs(High[counter]-Low[counter]);
}
Range=AvgRange/10;
fasterEMAnow = iMA(NULL, 0, FasterMAperiod, 0, FasterMAtype, PRICE_CLOSE, i);
fasterEMAprevious = iMA(NULL, 0, FasterMAperiod, 0, FasterMAtype, PRICE_CLOSE, i+1);
fasterEMAafter = iMA(NULL, 0, FasterMAperiod, 0, FasterMAtype, PRICE_CLOSE, i-1);
slowerEMAnow = iMA(NULL, 0, SlowerMAperiod, 0, SlowerMAtype, PRICE_CLOSE, i);
slowerEMAprevious = iMA(NULL, 0, SlowerMAperiod, 0, SlowerMAtype, PRICE_CLOSE, i+1);
slowerEMAafter = iMA(NULL, 0, SlowerMAperiod, 0, SlowerMAtype, PRICE_CLOSE, i-1);
if ((fasterEMAnow > slowerEMAnow) && (fasterEMAprevious < slowerEMAprevious) && (fasterEMAafter > slowerEMAafter)) {
CrossUp[i] = Low[i] - Range*0.5;
if ((loop == 0) && (CurrentTrend != 1) && (TimeLocal() - starttime >= 10)) {
if (Show_Alert == 1) {
Alert("Cross Up on " + Symbol() + " " + Period() + "min " + FasterMAperiod + "/" + SlowerMAperiod + " EMA");
}
if (Play_Sound == 1) {
PlaySound(SoundFilename);
}
if (Send_Mail == 1) {
SendMail("Cross Up on " + Symbol() + " " + Period() + "min " + FasterMAperiod + "/" + SlowerMAperiod + " EMA", "");
}
CurrentTrend = 1;
}
if (loop == 0) {
loop = 1;
}
}
else if ((fasterEMAnow < slowerEMAnow) && (fasterEMAprevious > slowerEMAprevious) && (fasterEMAafter < slowerEMAafter)) {
CrossDown[i] = High[i] + Range*0.5;
if ((loop == 0) && (CurrentTrend != -1) && (TimeLocal() - starttime >= 10)) {
if (Show_Alert == 1) {
Alert("Cross Down on " + Symbol() + " " + Period() + "min " + FasterMAperiod + "/" + SlowerMAperiod + " EMA");
}
if (Play_Sound == 1) {
PlaySound(SoundFilename);
}
if (Send_Mail == 1) {
SendMail("Cross Down on " + Symbol() + " " + Period() + "min " + FasterMAperiod + "/" + SlowerMAperiod + " EMA", "");
}
CurrentTrend = -1;
}
if (loop == 0) {
loop = 1;
}
}
}
return(0);
}
Sample
Analysis
Market Information Used:
Series array that contains the highest prices of each bar
Series array that contains the lowest prices of each bar
Indicator Curves created:
Implements a curve of type DRAW_ARROW
Indicators Used:
Moving average indicator
Custom Indicators Used:
Order Management characteristics:
Other Features:
It issuies visual alerts to the screen
It plays sound alerts
It sends emails