//+------------------------------------------------------------------+
//|                                                          CCI.mq4 |
//|                      Copyright © 2004, MetaQuotes Software Corp. |
//|                                       http://www.metaquotes.net/ |
//+------------------------------------------------------------------+
//2009fxtsd
#property copyright "Copyright © 2004, MetaQuotes Software Corp."
#property link      "http://www.metaquotes.net/"
//----
#property indicator_separate_window
#property indicator_buffers 2
#property indicator_color1 LightSeaGreen
#property indicator_color2 Green

//---- input parameters
extern int macd1MAfast =5;
extern int macd1MAslow =13;
extern int macd1SigMA  =5;

extern int macd2MAfast =12;
extern int macd2MAslow =26;
extern int macd2SigMA  =9;

extern int macd1LnMode=0;//0main,1sig
extern int macd2LnMode=0;

extern int slopePeriod=2; //0main,1sig
extern int TimeFrame = 0;

//---- buffers
double buffer1[];
double buffer2[];

//+------------------------------------------------------------------+
//| Custom indicator initialization function                         |
//+------------------------------------------------------------------+

int init()
  {
//---- indicator lines

   SetIndexBuffer(0, buffer1);
   SetIndexBuffer(1, buffer2);
//----
//----
   TimeFrame=MathMax(TimeFrame,Period());

//---- name for DataWindow and indicator subwindow label
   string name1= " macd1 ("+macd1MAfast+","+macd1MAslow+","+macd1SigMA+") ";
   string name2= " macd2 ("+macd2MAfast+","+macd2MAslow+","+macd2SigMA+") ";
   string name3= " slope ("+slopePeriod+") ";

   IndicatorShortName(name1+name2+name3+TimeFrame);
   SetIndexLabel(0, name1);
   SetIndexLabel(1, name2);


//----
   return(0);
  }
//+------------------------------------------------------------------+
//| Commodity Channel Index                                          |
//+------------------------------------------------------------------+
int start()
  {
   datetime TimeArray[];
   int    i,limit,y=0,counted_bars=IndicatorCounted();

// Plot defined timeframe on to current timeframe
   ArrayCopySeries(TimeArray,MODE_TIME,Symbol(),TimeFrame);

      limit=Bars-counted_bars;
      if (TimeFrame != Period())
      limit = MathMax(limit,TimeFrame/Period());

   for(i=0,y=0;i<limit;i++)
   {
   if (Time[i]<TimeArray[y]) y++;
//---- main loop

       buffer1[i] = iMACD(NULL,TimeFrame,macd1MAfast,macd1MAslow,macd1SigMA,PRICE_CLOSE,macd1LnMode,y)-
                    iMACD(NULL,TimeFrame,macd1MAfast,macd1MAslow,macd1SigMA,PRICE_CLOSE,macd1LnMode,y+slopePeriod);

       buffer2[i] = iMACD(NULL,TimeFrame,macd2MAfast,macd2MAslow,macd2SigMA,PRICE_CLOSE,macd2LnMode,y)-
                    iMACD(NULL,TimeFrame,macd2MAfast,macd2MAslow,macd2SigMA,PRICE_CLOSE,macd2LnMode,y+slopePeriod);
   }

return(0);

  }
Sample
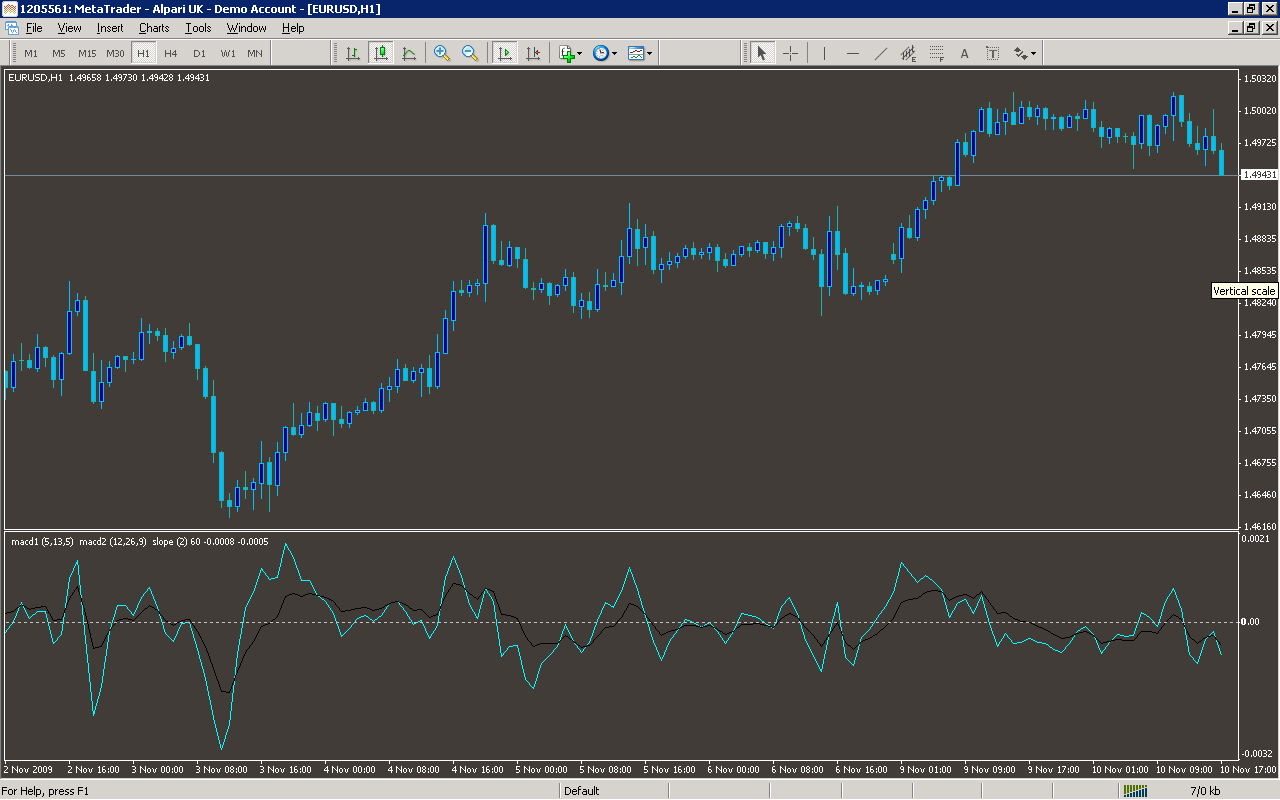
Analysis
Market Information Used:
Series array that contains open time of each bar
Indicator Curves created:
Indicators Used:
MACD Histogram
Custom Indicators Used:
Order Management characteristics:
Other Features: