//+------------------------------------------------------------------+
//|                                       OverLay Chart.mq4 Ver.1.10 |
//|                                      Copyright© 2006-2007 S.B.T. |
//|                                     http://sufx.core.t3-ism.net/ |
//+------------------- DO NOT REMOVE THIS HEADER --------------------+
//|  This script is free to use/distribute/modify and re-distribute. |
//|                                  (Limited to noncommercial use.) |
//+------------------------------------------------------------------+

//Indicator Properties
#property copyright "Copyright© 2006 S.B.T."
#property link      "http://sufx.core.t3-ism.net/"
#property indicator_chart_window
#property indicator_buffers 4


//Indicator Parameters
extern string SubSymbol = "USDJPY";
extern color BullBarColor = MediumSeaGreen;
extern color BearBarColor = Orange;
extern color GridColor = Black;
extern bool Mirroring = false;

//Global Variables
string Prefix; //Indicator Prefix
int Grid = 10; //Grid Lines
int SnapPips = 10;  //Snap Pips For Grid Lines


//Indicator Buffers
double ExtMapBuffer1[];
double ExtMapBuffer2[];
double ExtMapBuffer3[];
double ExtMapBuffer4[];


//+------------------------------------------------------------------+
//| Custom indicator initialization function                         |
//+------------------------------------------------------------------+
int init() {

   //Initialize Indexes
   Prefix = "OverLayChart" + SubSymbol;

   IndicatorShortName( "OverLay Chart( " + SubSymbol + " )" );

   SetIndexBuffer( 0, ExtMapBuffer1 );
   SetIndexBuffer( 1, ExtMapBuffer2 );
   SetIndexBuffer( 2, ExtMapBuffer3 );
   SetIndexBuffer( 3, ExtMapBuffer4 );

   SetIndexStyle( 0, DRAW_HISTOGRAM, DRAW_LINE, 1, BullBarColor );
   SetIndexStyle( 1, DRAW_HISTOGRAM, DRAW_LINE, 1, BearBarColor );
   SetIndexStyle ( 2, DRAW_HISTOGRAM, DRAW_LINE, 3, BullBarColor );
   SetIndexStyle( 3, DRAW_HISTOGRAM, DRAW_LINE, 3, BearBarColor );

   SetIndexEmptyValue( 0, 0.0 );
   SetIndexEmptyValue( 1, 0.0 );
   SetIndexEmptyValue( 2, 0.0 );
   SetIndexEmptyValue( 3, 0.0 );


   return( 0 );
}


//+------------------------------------------------------------------+
//| Custom indicator deinitialization function                       |
//+------------------------------------------------------------------+
int deinit() {
   int _i;


   //Delete Objects
	ObjectDelete( Prefix + "Status" );
	ObjectDelete( Prefix + "Copyright" );

	for ( _i = 1; _i <= Grid ; _i ++ ) {
   	ObjectDelete( Prefix + "Grid" + _i );
   	ObjectDelete( Prefix + "Price" + _i );
   }


   return( 0 );
}


//+------------------------------------------------------------------+
//| Custom indicator iteration function                              |
//+------------------------------------------------------------------+
int start() {
   int _BarsCount;
   double _CurRangeHigh, _CurRangeLow, _CurRangeCenter;
   double _SubRangeHigh, _SubRangeLow, _SubRangeCenter;
   double _SubPoint, _SubDigit;
   double _SubOpen, _SubHigh, _SubLow, _SubClose;
   double _PipsRatio;
   double _GridPips, _GridPrice;
   int _i;


   //Initialize Buffers
	RefreshRates();

   ArrayInitialize( ExtMapBuffer1, 0.0 );
   ArrayInitialize( ExtMapBuffer2, 0.0 );
   ArrayInitialize( ExtMapBuffer3, 0.0 );
   ArrayInitialize( ExtMapBuffer4, 0.0 );


   //Calculate Visible Bars
   _BarsCount = BarsPerWindow() + 1;
   int _FirstBar = FirstVisibleBar();
   int _LastBar = _FirstBar - _BarsCount + 1;
   if ( _LastBar < 0 ) {
      _LastBar = 0;
      _BarsCount = _FirstBar + 1;
   }


   //Calculate Chart Ratio
   _CurRangeHigh = High[Highest(NULL, 0, MODE_HIGH, _BarsCount, _LastBar)];
   _CurRangeLow = Low[Lowest(NULL, 0, MODE_LOW, _BarsCount, _LastBar)];
   _CurRangeCenter = ( _CurRangeHigh + _CurRangeLow ) / 2;

   if ( Mirroring ) {
      _SubRangeHigh = iLow( SubSymbol, 0, Lowest( SubSymbol, 0, MODE_LOW, _BarsCount, _LastBar ) );
      _SubRangeLow = iHigh( SubSymbol, 0, Highest( SubSymbol, 0, MODE_HIGH, _BarsCount, _LastBar ) );
   } else {
      _SubRangeHigh = iHigh( SubSymbol, 0, Highest( SubSymbol, 0, MODE_HIGH, _BarsCount, _LastBar ) );
      _SubRangeLow = iLow( SubSymbol, 0, Lowest( SubSymbol, 0, MODE_LOW, _BarsCount, _LastBar ) );
   }

   _SubRangeCenter = ( _SubRangeHigh + _SubRangeLow ) / 2;
   _SubPoint = MarketInfo( SubSymbol, MODE_POINT );
   _SubDigit = MarketInfo( SubSymbol, MODE_DIGITS );

   _PipsRatio = ( _CurRangeHigh - _CurRangeLow )  / ( _SubRangeHigh - _SubRangeLow );

   _GridPips = ( _SubRangeHigh - _SubRangeLow ) / Grid;
   _GridPips = MathRound( ( _SubRangeHigh - _SubRangeLow ) / Grid / ( _SubPoint * SnapPips ) ) * ( _SubPoint * SnapPips );


   //Draw Candlesticks
	for ( _i = _LastBar; _i < _LastBar + _BarsCount; _i ++ ) {
      _SubOpen = iOpen( SubSymbol, 0, _i ) - _SubRangeCenter;
      _SubHigh = iHigh( SubSymbol, 0, _i ) - _SubRangeCenter;
      _SubLow = iLow( SubSymbol, 0, _i ) - _SubRangeCenter;
      _SubClose = iClose( SubSymbol, 0, _i ) - _SubRangeCenter;

      if ( Mirroring ) {
         if ( _SubOpen < _SubClose ) {
            ExtMapBuffer2[_i] = _CurRangeCenter + _SubHigh * _PipsRatio;
            ExtMapBuffer1[_i] = _CurRangeCenter + _SubLow * _PipsRatio;
         } else {
            ExtMapBuffer2[_i] = _CurRangeCenter + _SubLow * _PipsRatio;
            ExtMapBuffer1[_i] = _CurRangeCenter + _SubHigh * _PipsRatio;
         }

         ExtMapBuffer4[_i] = _CurRangeCenter + _SubClose * _PipsRatio;
         ExtMapBuffer3[_i] = _CurRangeCenter + _SubOpen * _PipsRatio;
      } else {
         if ( _SubOpen < _SubClose ) {
            ExtMapBuffer1[_i] = _CurRangeCenter + _SubHigh * _PipsRatio;
            ExtMapBuffer2[_i] = _CurRangeCenter + _SubLow * _PipsRatio;
         } else {
            ExtMapBuffer1[_i] = _CurRangeCenter + _SubLow * _PipsRatio;
            ExtMapBuffer2[_i] = _CurRangeCenter + _SubHigh * _PipsRatio;
         }
         ExtMapBuffer3[_i] = _CurRangeCenter + _SubClose * _PipsRatio;
         ExtMapBuffer4[_i] = _CurRangeCenter + _SubOpen * _PipsRatio;
      }
   }


   //Draw Objects
   ObjectCreate( Prefix + "Copyright", OBJ_LABEL, 0, 0, 0 );
	ObjectSet( Prefix + "Copyright", OBJPROP_COLOR, GridColor );
   ObjectSet( Prefix + "Copyright", OBJPROP_CORNER, 3 );
   ObjectSet( Prefix + "Copyright", OBJPROP_XDISTANCE, 4 );
   ObjectSet( Prefix + "Copyright", OBJPROP_YDISTANCE, 4 );
   ObjectSetText( Prefix + "Copyright", "OverLay Chart by S.B.T.", 8 );

   ObjectCreate( Prefix + "Status", OBJ_LABEL, 0, 0, 0 );
	ObjectSet( Prefix + "Status", OBJPROP_COLOR, GridColor );
   ObjectSet( Prefix + "Status", OBJPROP_CORNER, 0 );
   ObjectSet( Prefix + "Status", OBJPROP_XDISTANCE, 4 );
   ObjectSet( Prefix + "Status", OBJPROP_YDISTANCE, 16 );
   ObjectSetText( Prefix + "Status",
                  SubSymbol + " O = " + DoubleToStr( iOpen( SubSymbol, 0, _LastBar ), _SubDigit ) +
                  ", H = " + DoubleToStr( iHigh( SubSymbol, 0, _LastBar ), _SubDigit ) +
                  ", L = " + DoubleToStr( iLow( SubSymbol, 0, _LastBar ), _SubDigit ) +
                  ", C = " + DoubleToStr( iClose( SubSymbol, 0, _LastBar ), _SubDigit ),
                  8 );

	for ( _i = 1; _i <= Grid ; _i ++ ) {
      _GridPrice = MathRound( _SubRangeCenter / ( _SubPoint * SnapPips ) ) * ( _SubPoint * SnapPips );
      _GridPrice = ( ( _GridPrice + _GridPips / 2 ) + _GridPips * ( Grid / 2 - 1 ) ) - ( _GridPips * ( _i - 1 ) );

		ObjectCreate( Prefix + "Grid" + _i, OBJ_TREND, 0, 0, 0 );
      ObjectSet( Prefix + "Grid" + _i, OBJPROP_TIME1, Time[_FirstBar] );
      ObjectSet( Prefix + "Grid" + _i, OBJPROP_PRICE1, _CurRangeCenter + ( _GridPrice - _SubRangeCenter ) * _PipsRatio );
      ObjectSet( Prefix + "Grid" + _i, OBJPROP_TIME2, Time[_LastBar] );
      ObjectSet( Prefix + "Grid" + _i, OBJPROP_PRICE2, _CurRangeCenter + ( _GridPrice - _SubRangeCenter ) * _PipsRatio );
		ObjectSet( Prefix + "Grid" + _i, OBJPROP_COLOR, GridColor );
		ObjectSet( Prefix + "Grid" + _i, OBJPROP_STYLE, STYLE_DOT );
		ObjectSet( Prefix + "Grid" + _i, OBJPROP_WIDTH, 1 );
		ObjectSet( Prefix + "Grid" + _i, OBJPROP_RAY, true );

		ObjectCreate( Prefix + "Price" + _i, OBJ_TEXT, 0, 0, 0 );
      ObjectSet( Prefix + "Price" + _i, OBJPROP_TIME1, Time[_FirstBar - _BarsCount / 10] );
      ObjectSet( Prefix + "Price" + _i, OBJPROP_PRICE1, _CurRangeCenter + ( _GridPrice - _SubRangeCenter ) * _PipsRatio );
		ObjectSet( Prefix + "Price" + _i, OBJPROP_COLOR, GridColor );
      ObjectSetText( Prefix + "Price" + _i, DoubleToStr( _GridPrice, _SubDigit ), 8 );
   }


   return( 0 );
}
//+------------------------------------------------------------------+
Sample
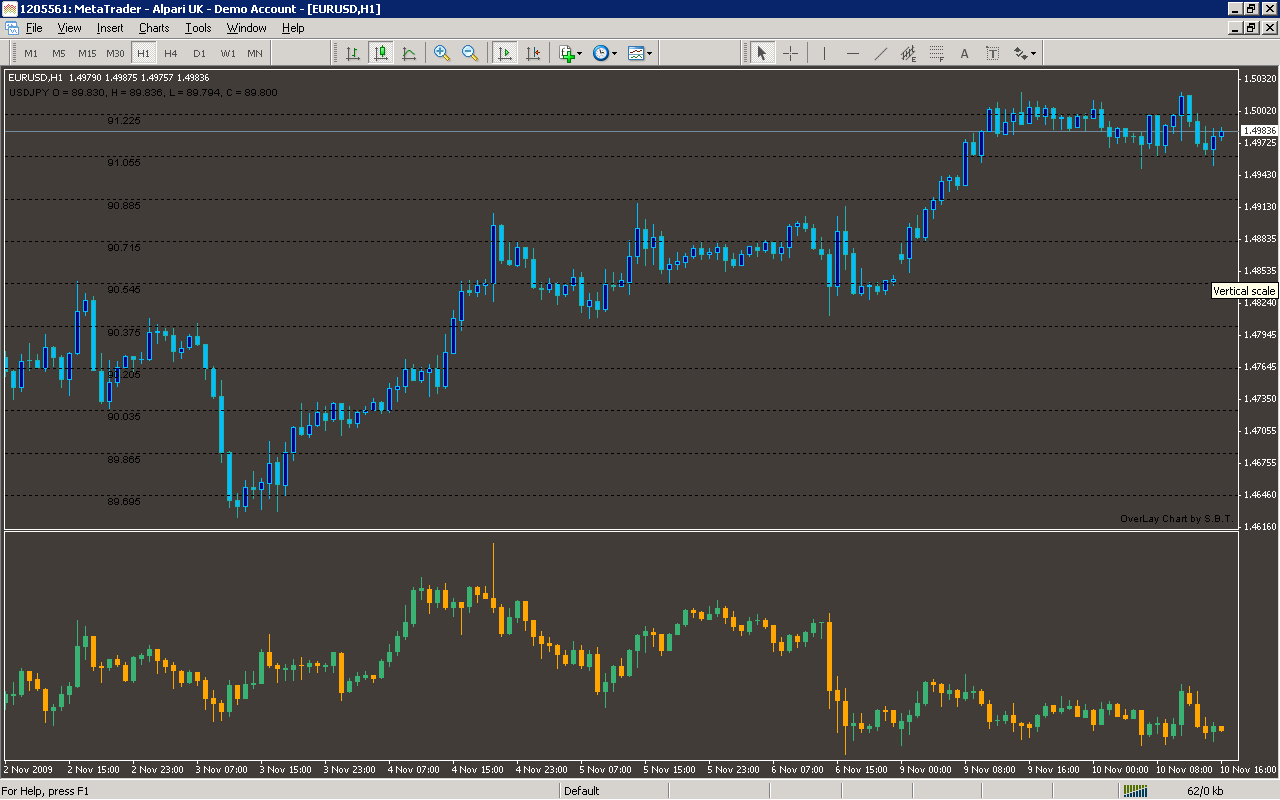
Analysis
Market Information Used:
Series array that contains the highest prices of each bar
Series array that contains the lowest prices of each bar
Series array that contains open prices of each bar
Series array that contains close prices for each bar
Series array that contains open time of each bar
Indicator Curves created:
Implements a curve of type DRAW_HISTOGRAM
Indicators Used:
Custom Indicators Used:
Order Management characteristics:
Other Features: