//+------------------------------------------------------------------+
//|                                            Market_Statistics.mq4 |
//|                                     Copyright © 2009, Akif TOKUZ |
//|                                             akifusenet@gmail.com |
//| Volume histogram implementation is based on Vadim Shumilov       |
//| (DrShumiloff)'s VolumesHist2.3 indicator. Other concepts are     |
//| inspired from Jperl's `Trading With Market Statistics` thread on |
//| Traders Laboratory.                                              |
//+------------------------------------------------------------------+
#property copyright "Copyright © 2009, Akif TOKUZ"
#property link      "akifusenet@gmail.com"

#property indicator_chart_window

#property indicator_buffers 8

#property indicator_color1 Red         //PVP
#property indicator_width1 2

#property indicator_color2 Aqua        //VWAP
#property indicator_width2 2

#property indicator_color3 Green       //SD1Pos
#property indicator_width3 1
#property indicator_style3 2

#property indicator_color4 Red         //SD1Neg
#property indicator_width4 1
#property indicator_style4 2

#property indicator_color5 DarkOliveGreen//SD2Pos
#property indicator_width5 1
#property indicator_style5 2

#property indicator_color6 Crimson     //SD2Neg
#property indicator_width6 1
#property indicator_style6 2

#property indicator_color7 DarkGreen   //SD2Pos
#property indicator_width7 1
#property indicator_style7 2

#property indicator_color8 FireBrick   //SD2Neg
#property indicator_width8 1
#property indicator_style8 2


//---- input parameters
extern datetime  StartDate=D'2009.08.06 00:00';
extern int    HistogramAmplitude = 100;
extern bool    Show_SD1 = true;
extern bool    Show_SD2 = false;
extern bool    Show_SD3 = false;
//---- buffers
double PVP[];
double VWAP[];
double SD1Pos[];
double SD1Neg[];
double SD2Pos[];
double SD2Neg[];
double SD3Pos[];
double SD3Neg[];

double Hist[]; // drawn specifically

datetime OpenTime = 0;  // To check if we have a new bar
string   OBJECT_PREFIX = "VolumeHistogram_";
int      items;         // numbers of items inside volume histogram
int      Bars_Back = 0; // Shows the starting bar for given date
double   SD;            // standart deviation


// Finds the bar number for the given date
int FindStartIndex(datetime startDate)
{
   for (int i=Bars-1; i>=0; i--)
   {
      if (Time[i]>=StartDate) return (i);
   }
   return( 0);
}


int init()
{
   Bars_Back=FindStartIndex(StartDate);
   ObjectSet( "Starting_Time", OBJPROP_TIME1, Time[Bars_Back]);
   ObjectSet("Starting_Time", OBJPROP_COLOR, Red);
   ObjectCreate("Starting_Time", OBJ_VLINE, 0, Time[Bars_Back], 0);

//---- indicators
   IndicatorBuffers(8);

   SetIndexStyle(0,DRAW_LINE);
   SetIndexLabel(0,"PVP");
   SetIndexBuffer(0,PVP);

   SetIndexStyle(1,DRAW_LINE);
   SetIndexLabel(1,"VWAP");
   SetIndexBuffer(1,VWAP);

   if (Show_SD1==true) SetIndexStyle(2,DRAW_LINE);
   else  SetIndexStyle(2,DRAW_NONE);
   SetIndexLabel(2,"SD1Pos");
   SetIndexBuffer(2,SD1Pos);

   if (Show_SD1==true) SetIndexStyle(3,DRAW_LINE);
   else  SetIndexStyle(3,DRAW_NONE);
   SetIndexLabel(3,"SD1Neg");
   SetIndexBuffer(3,SD1Neg);

   if (Show_SD2==true) SetIndexStyle(4,DRAW_LINE);
   else  SetIndexStyle(4,DRAW_NONE);
   SetIndexLabel(4,"SD2Pos");
   SetIndexBuffer(4,SD2Pos);

   if (Show_SD2==true) SetIndexStyle(5,DRAW_LINE);
   else  SetIndexStyle(5,DRAW_NONE);
   SetIndexLabel(5,"SD2Neg");
   SetIndexBuffer(5,SD2Neg);

   if (Show_SD3==true) SetIndexStyle(6,DRAW_LINE);
   else  SetIndexStyle(6,DRAW_NONE);
   SetIndexLabel(6,"SD3Pos");
   SetIndexBuffer(6,SD3Pos);

   if (Show_SD3==true) SetIndexStyle(7,DRAW_LINE);
   else  SetIndexStyle(7,DRAW_NONE);
   SetIndexLabel(7,"SD3Neg");
   SetIndexBuffer(7,SD3Neg);

   string short_name="Market_Statistics";
   IndicatorShortName(short_name);


   return(0);
}


// Delete all objects with given prefix
void ObDeleteObjectsByPrefix(string Prefix)
{
   int L = StringLen(Prefix);
   int i = 0;
   while(i < ObjectsTotal())
   {
       string ObjName = ObjectName(i);
       if(StringSubstr(ObjName, 0, L) != Prefix)
       {
           i++;
           continue;
       }
       ObjectDelete(ObjName);
   }
}


int start()
{
   double TotalVolume=0;
   double TotalPV=0;
   int n;

   if (OpenTime != Open[0])
   {
      Bars_Back=FindStartIndex(StartDate);
      //ObjectSet( "Starting_Time", OBJPROP_TIME1, Time[Bars_Back]);

      OpenTime = Open[0];

      double max = High[iHighest( NULL , 0, MODE_HIGH, Bars_Back, 0)];
      double min =  Low[ iLowest( NULL , 0, MODE_LOW,  Bars_Back, 0)];
      items = MathRound((max - min) / Point);

      ArrayResize(Hist, items);
      ArrayInitialize(Hist, 0);

      TotalVolume=0;
      TotalPV=0;
      for (int i = Bars_Back; i >= 1; i--)
      {
         double t1 = Low[i], t2 = Open[i], t3 = Close[i], t4 = High[i];
         if (t2 > t3) {t3 = Open[i]; t2 = Close[i];}
         double totalRange = 2*(t4 - t1) - t3 + t2;

         if (totalRange != 0.0)
         {
            for (double Price_i = t1; Price_i <= t4; Price_i += Point)
            {
               n = MathRound((Price_i - min) / Point);

               if (t1 <= Price_i && Price_i <  t2)
               {
                  Hist[n] += MathRound(Volume[i]*2*(t2-t1)/totalRange);
               }
               if (t2 <= Price_i && Price_i <= t3)
               {
                  Hist[n] += MathRound(Volume[i]*(t3-t2)/totalRange);
               }
               if (t3 <  Price_i && Price_i <= t4)
               {
                  Hist[n] += MathRound(Volume[i]*2*(t4-t3)/totalRange);
               }
            }//for
         }else
         {
            // Check if all values are equal to each other
            n = MathRound((t3 - min) / Point);
            Hist[n] += Volume[i];
         }//if


         // use H+L+C/3 as average price
         TotalPV+=Volume[i]*((Low[i]+High[i]+Close[i])/3);
         TotalVolume+=Volume[i];

         if (i==Bars_Back) PVP[i]=Close[i];
         else PVP[i]=min+ArrayMaximum(Hist)*Point;

         if (i==Bars_Back) VWAP[i]=Close[i];
         else VWAP[i]=TotalPV/TotalVolume;


         SD=0;
         for (int k = Bars_Back; k >= i; k--)
         {
            double avg=(High[k]+Close[k]+Low[k])/3;
            double diff=avg-VWAP[i];
            SD+=(Volume[k]/TotalVolume)*(diff*diff);
          }
          SD=MathSqrt(SD);
          SD1Pos[i]=VWAP[i]+SD;
          SD1Neg[i]=VWAP[i]-SD;
          SD2Pos[i]=SD1Pos[i]+SD;
          SD2Neg[i]=SD1Neg[i]-SD;
          SD3Pos[i]=SD2Pos[i]+SD;
          SD3Neg[i]=SD2Neg[i]-SD;
      }//for

      ObDeleteObjectsByPrefix(OBJECT_PREFIX);

      int MaxVolume = Hist[ArrayMaximum(Hist)];
      int multiplier;
      for (i = 0; i <= items; i++)
      {
         // Protection if we have less bar than amplitude yet
         if (Bars_Back<HistogramAmplitude) multiplier=Bars_Back;
         else multiplier=HistogramAmplitude;

         if (MaxVolume != 0) Hist[i] = MathRound(multiplier * Hist[i] / MaxVolume );

         if (Hist[i] > 0)
         {
            int time_i = Bars_Back-Hist[i];
            if (time_i>=0)
            {
               ObjectCreate(OBJECT_PREFIX+i, OBJ_RECTANGLE, 0, Time[Bars_Back], min + i*Point, Time[time_i], min + (i+1)*Point);
               ObjectSet(OBJECT_PREFIX+i, OBJPROP_STYLE, DRAW_HISTOGRAM);
               ObjectSet(OBJECT_PREFIX+i, OBJPROP_COLOR, Teal);
               ObjectSet(OBJECT_PREFIX+i, OBJPROP_BACK, true);
            }//if
         } //if
      }//for
   }//MAIN IF BAR START
   return(0);
}

int deinit()
{
   ObDeleteObjectsByPrefix(OBJECT_PREFIX);
   ObjectDelete("Starting_Time");
   return(0);
}
Sample
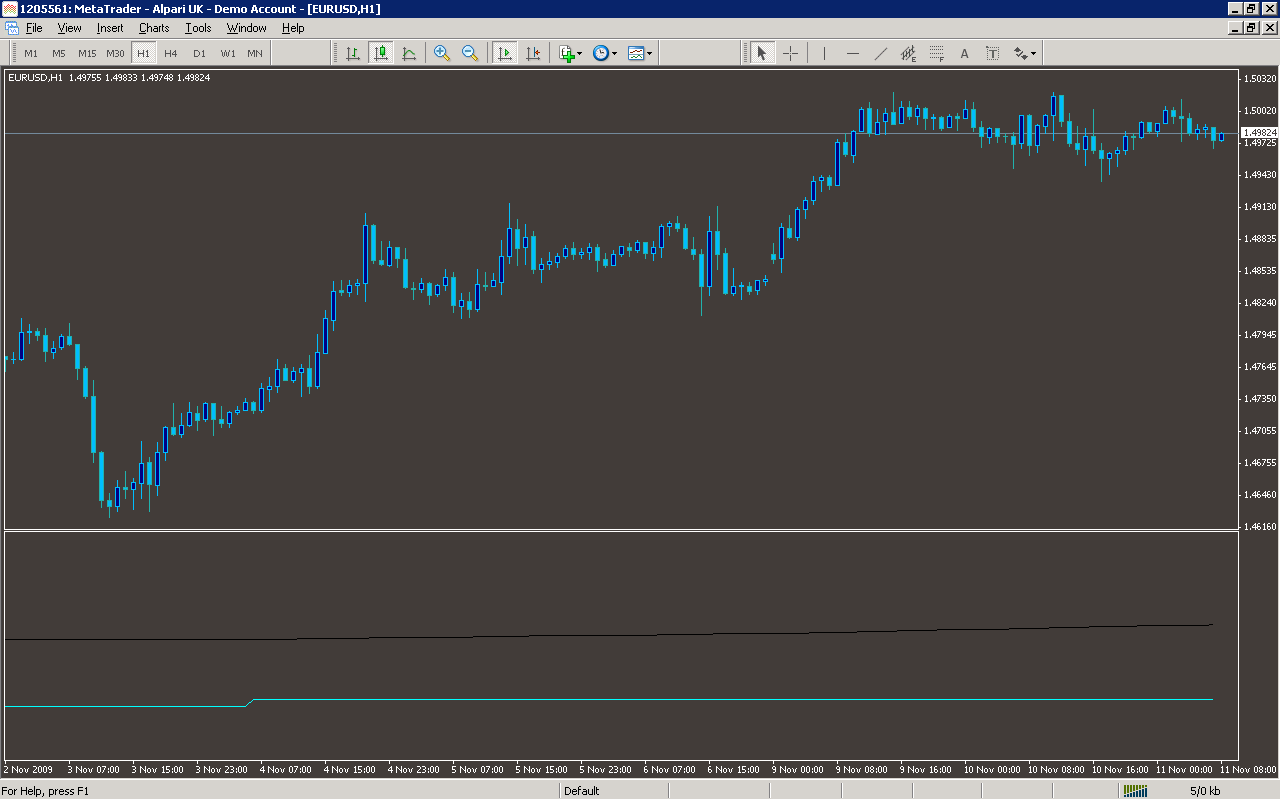
Analysis
Market Information Used:
Series array that contains open time of each bar
Series array that contains open prices of each bar
Series array that contains the highest prices of each bar
Series array that contains the lowest prices of each bar
Series array that contains close prices for each bar
Series array that contains tick volumes of each bar
Indicator Curves created:
Implements a curve of type DRAW_LINE
Implements a curve of type DRAW_NONE
Indicators Used:
Custom Indicators Used:
Order Management characteristics:
Other Features: