//+------------------------------------------------------------------+
//|  MTF_Keltner_ATR_Bands                    Keltner ATR Bands .mq4 |
//|                                     This is not Keltner Channels |
//|(MTF ForexTSD.com 2007)                                           |
//| kerris formula     ki                  Converted by : Dr. Gaines |
//|                                      dr_richard_gaines@yahoo.com |
//+------------------------------------------------------------------+
#property copyright " Copyright © 2005, MetaQuotes Software Corp."
#property link      " http://www.metaquotes.net/"
//----
#property indicator_chart_window
#property indicator_buffers 2
#property indicator_color1 Red
#property indicator_color2 Red

//---- input parameters
/*************************************************************************
PERIOD_M1   1
PERIOD_M5   5
PERIOD_M15  15
PERIOD_M30  30
PERIOD_H1   60
PERIOD_H4   240
PERIOD_D1   1440
PERIOD_W1   10080
PERIOD_MN1  43200
You must use the numeric value of the timeframe that you want to use
when you set the TimeFrame' value with the indicator inputs.
---------------------------------------
**************************************************************************/
extern double MAPeriod=50;
extern double ATRMult=3.75;
extern int TimeFrame = 0;
extern string note_TimeFrames = "M1;5,15,30,60H1;240H4;1440D1;10080W1;43200MN";

double ExtMapBuffer1[];
double ExtMapBuffer2[];

//+------------------------------------------------------------------+
//| Custom indicator initialization function                         |
//+------------------------------------------------------------------+
int init()
  {

//---- indicator line
   SetIndexBuffer(0, ExtMapBuffer1);
   SetIndexStyle (0,DRAW_LINE);
   SetIndexLabel (0, "Ketl_Bands("+MAPeriod+","+ATRMult+") ["+TimeFrame+"]");

   SetIndexBuffer(1,ExtMapBuffer2);
   SetIndexStyle(1,DRAW_LINE);
   SetIndexLabel (1, "Ketl_Bands("+MAPeriod+","+ATRMult+") ["+TimeFrame+"]");
    if (TimeFrame < Period()) TimeFrame = Period();

//---- name for DataWindow and indicator subwindow label
   switch(TimeFrame)
   {
      case 1 : string TimeFrameStr="Period_M1"; break;
      case 5 : TimeFrameStr="Period_M5"; break;
      case 15 : TimeFrameStr="Period_M15"; break;
      case 30 : TimeFrameStr="Period_M30"; break;
      case 60 : TimeFrameStr="Period_H1"; break;
      case 240 : TimeFrameStr="Period_H4"; break;
      case 1440 : TimeFrameStr="Period_D1"; break;
      case 10080 : TimeFrameStr="Period_W1"; break;
      case 43200 : TimeFrameStr="Period_MN1"; break;
      default : TimeFrameStr="Current Timeframe";
   }
   IndicatorShortName("Ketl_Bands("+MAPeriod+","+ATRMult+") ["+TimeFrame+"]");
  }
//----
   return(0);

//+------------------------------------------------------------------+
//|MTF_ADXcrossSig                                                   |
//+------------------------------------------------------------------+
int start()
  {
   datetime TimeArray[];
   int    i,limit,y=0,counted_bars=IndicatorCounted();

// Plot defined timeframe on to current timeframe
   ArrayCopySeries(TimeArray,MODE_TIME,Symbol(),TimeFrame);
     limit = Bars-counted_bars;
     limit = MathMax(limit,TimeFrame/Period());
     for(i=0,y=0;i<limit;i++)
   {
   if (Time[i]<TimeArray[y]) y++;

 /***********************************************************
   Add your main indicator loop below.  You can reference an existing
      indicator with its iName  or iCustom.
   Rule 1:  Add extern inputs above for all neccesary values
   Rule 2:  Use 'TimeFrame' for the indicator timeframe
   Rule 3:  Use 'y' for the indicator's shift value
 **********************************************************/

   ExtMapBuffer1[i]=iCustom(NULL,TimeFrame,"Keltner_ATR_Bands",MAPeriod,ATRMult,0,y);
   ExtMapBuffer2[i]=iCustom(NULL,TimeFrame,"Keltner_ATR_Bands",MAPeriod,ATRMult,1,y);

   }
 //
// Refresh buffers
//++++++++++++++++++++++++++++++++++++++   upgrade by Raff
   if (TimeFrame>Period()) {
     int PerINT=TimeFrame/Period()+1;
     datetime TimeArr[]; ArrayResize(TimeArr,PerINT);
     ArrayCopySeries(TimeArr,MODE_TIME,Symbol(),Period());
     for(i=0;i<PerINT+1;i++) {if (TimeArr[i]>=TimeArray[0]) {
//----
 /********************************************************
    Refresh buffers:         buffer[i] = buffer[0];
 ********************************************************/

   ExtMapBuffer1[i]=ExtMapBuffer1[0];
   ExtMapBuffer2[i]=ExtMapBuffer2[0];
//----
   } } }
//+++++++++++++++++++++++++++++++++++++++++++++++   Raff


   return(0);
  }
//+------------------------------------------------------------------+
Sample
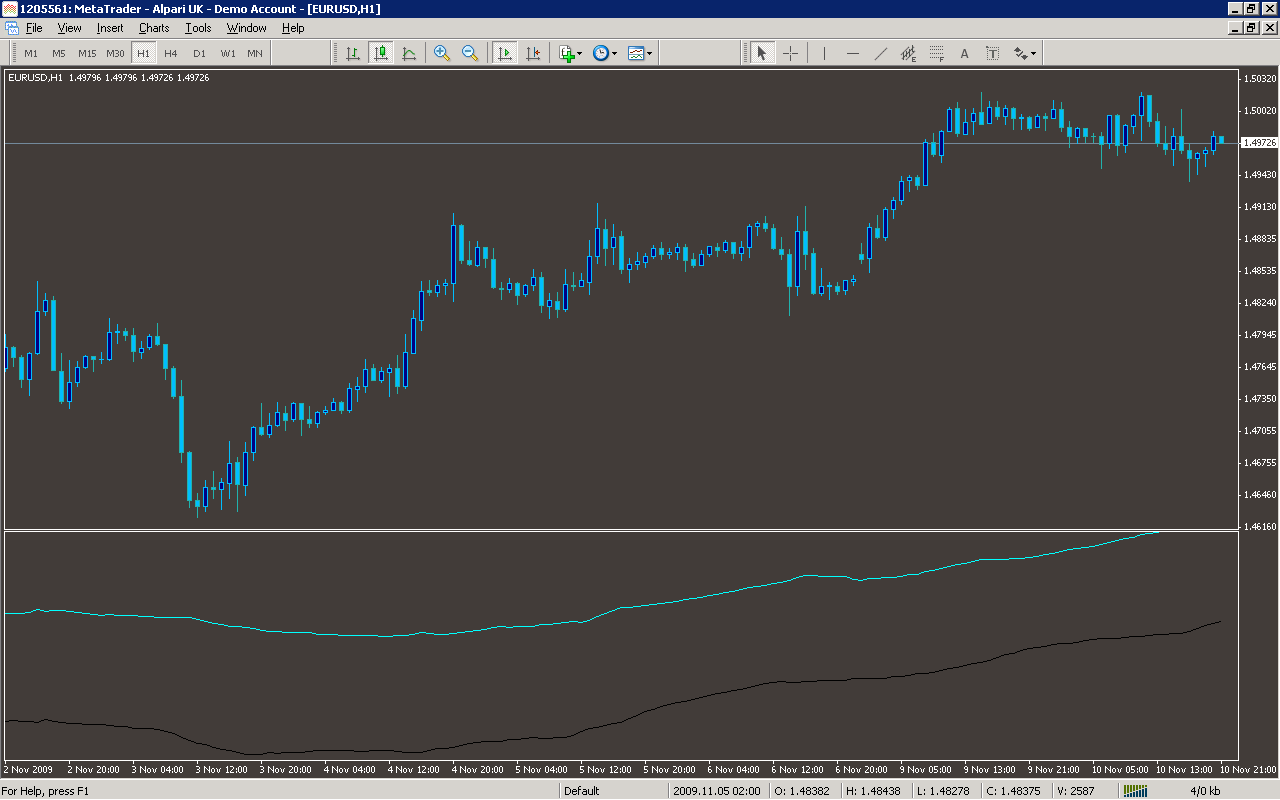
Analysis
Market Information Used:
Series array that contains open time of each bar
Indicator Curves created:
Implements a curve of type DRAW_LINE
Indicators Used:
Custom Indicators Used:
Keltner_ATR_Bands
Order Management characteristics:
Other Features: