//+------------------------------------------------------------------+
//|                                                   MTF_T3_RSI.mq4 |
//|                      Copyright © 2009, MetaQuotes Software Corp. |
//|                                        http://www.metaquotes.net |
//+------------------------------------------------------------------+
#property copyright "Copyright © 2009, MetaQuotes Software Corp."
#property link      "http://www.metaquotes.net"

#property indicator_separate_window
#property indicator_buffers 2
#property indicator_color1 Red
#property indicator_color2 White
#property indicator_level1 30
#property indicator_level2 50
#property indicator_level3 70
#property indicator_minimum 10
#property indicator_maximum 100
//
extern int TimeFrame=0;
extern int RSI_Period = 9;
extern int T3_Period = 9;
extern double T3_Curvature = 0.9;

//
double ExtMapBuffer1[];
double ExtMapBuffer2[];
//
//+------------------------------------------------------------------+
//| Custom indicator initialization function                         |
//+------------------------------------------------------------------+
int init()
  {
//---- indicator line
SetIndexStyle(0,DRAW_LINE,STYLE_SOLID,1);
SetIndexStyle(1,DRAW_LINE,STYLE_SOLID,1);

IndicatorDigits(MarketInfo(Symbol(),MODE_DIGITS));
IndicatorShortName("T3 RSI "+T3_Period);

SetIndexBuffer(0,ExtMapBuffer1);
SetIndexLabel(0,"T3 "+T3_Period);

SetIndexBuffer(1,ExtMapBuffer2);
SetIndexLabel(1,"RSI "+T3_Period);


//----
//---- name for DataWindow and indicator subwindow label
   switch(TimeFrame)
   {
      case 1 : string TimeFrameStr="Period_M1"; break;
      case 5 : TimeFrameStr="Period_M5"; break;
      case 15 : TimeFrameStr="Period_M15"; break;
      case 30 : TimeFrameStr="Period_M30"; break;
      case 60 : TimeFrameStr="Period_H1"; break;
      case 240 : TimeFrameStr="Period_H4"; break;
      case 1440 : TimeFrameStr="Period_D1"; break;
      case 10080 : TimeFrameStr="Period_W1"; break;
      case 43200 : TimeFrameStr="Period_MN"; break;
      default : TimeFrameStr="TF0";
   }
   IndicatorShortName("MTF_T3 RSI("+RSI_Period+","+T3_Period+","+DoubleToStr(T3_Curvature,2)+") ("+TimeFrameStr+") ");

  }
//----
   return(0);


//+------------------------------------------------------------------+
//| MTF T3 RSI                                                       |
//+------------------------------------------------------------------+
int start()
  {
   datetime TimeArray[];
   int    i,limit,y=0,counted_bars=IndicatorCounted();

// Plot defined time frame on to current time frame
   ArrayCopySeries(TimeArray,MODE_TIME,Symbol(),TimeFrame);
   limit=Bars-counted_bars + TimeFrame/Period();
   for(i=0,y=0;i<limit;i++)
   {
   if (Time[i]<TimeArray[y]) y++;

   ExtMapBuffer1[i]=iCustom(NULL,TimeFrame,"T3_RSI",RSI_Period,T3_Period,T3_Curvature,0,y);
   ExtMapBuffer2[i]=iCustom(NULL,TimeFrame,"T3_RSI",RSI_Period,T3_Period,T3_Curvature,1,y);

   }
//----
return(0);
}
//+------------------------------------------------------------------+
Sample
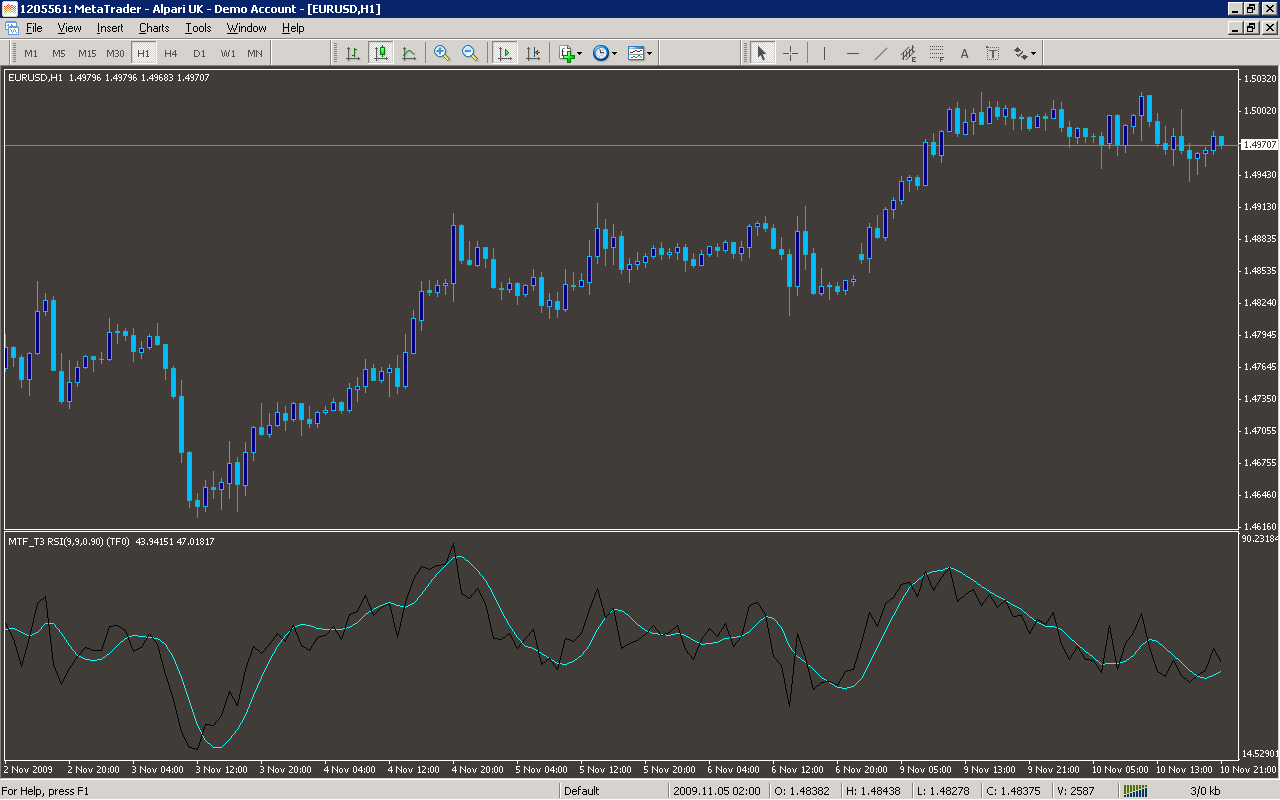
Analysis
Market Information Used:
Series array that contains open time of each bar
Indicator Curves created:
Implements a curve of type DRAW_LINE
Indicators Used:
Custom Indicators Used:
T3_RSI
Order Management characteristics:
Other Features: