//+------------------------------------------------------------------+
//|                                                   MTF_T3_RSI.mq4 |
//|                      Copyright © 2009, MetaQuotes Software Corp. |
//|                                        http://www.metaquotes.net |
//+------------------------------------------------------------------+
#property copyright "Copyright © 2009, MetaQuotes Software Corp."
#property link      "http://www.metaquotes.net"

#property indicator_separate_window
#property indicator_buffers 2
#property indicator_color1 Red
#property indicator_color2 White
#property indicator_level1 30
#property indicator_level2 50
#property indicator_level3 70
#property indicator_minimum 10
#property indicator_maximum 100
//
extern int TimeFrame=0;
extern int RSI_Period = 9;
extern int T3_Period = 9;
extern double T3_Curvature = 0.9;

double t3Array[];
double rsiArray[];

double e1,e2,e3,e4,e5,e6;
double c1,c2,c3,c4;
double n,w1,w2,b2,b3;
//
double ExtMapBuffer1[];
double ExtMapBuffer2[];
//
//+------------------------------------------------------------------+
//| Custom indicator initialization function                         |
//+------------------------------------------------------------------+
int init()
  {
//---- indicator line
SetIndexStyle(0,DRAW_LINE,STYLE_SOLID,1);
SetIndexStyle(1,DRAW_LINE,STYLE_SOLID,1);

IndicatorDigits(MarketInfo(Symbol(),MODE_DIGITS));
IndicatorShortName("T3 RSI "+T3_Period);

SetIndexBuffer(0,t3Array);
SetIndexLabel(0,"T3 "+T3_Period);

SetIndexBuffer(1,rsiArray);
SetIndexLabel(1,"RSI "+T3_Period);

//---- variable reset

e1=0; e2=0; e3=0; e4=0; e5=0; e6=0;
c1=0; c2=0; c3=0; c4=0;
n=0;
w1=0; w2=0;
b2=0; b3=0;

b2=T3_Curvature*T3_Curvature;
b3=b2*T3_Curvature;
c1=-b3;
c2=(3*(b2+b3));
c3=-3*(2*b2+T3_Curvature+b3);
c4=(1+3*T3_Curvature+b3+3*b2);
n=T3_Period;

if (n<1) n=1;
n = 1 + 0.5*(n-1);
w1 = 2 / (n + 1);
w2 = 1 - w1;

//----
//---- name for DataWindow and indicator subwindow label
   switch(TimeFrame)
   {
      case 1 : string TimeFrameStr="Period_M1"; break;
      case 5 : TimeFrameStr="Period_M5"; break;
      case 15 : TimeFrameStr="Period_M15"; break;
      case 30 : TimeFrameStr="Period_M30"; break;
      case 60 : TimeFrameStr="Period_H1"; break;
      case 240 : TimeFrameStr="Period_H4"; break;
      case 1440 : TimeFrameStr="Period_D1"; break;
      case 10080 : TimeFrameStr="Period_W1"; break;
      case 43200 : TimeFrameStr="Period_MN1"; break;
      default : TimeFrameStr="Current Timeframe";
   }
   IndicatorShortName("MTF_T3 RSI("+RSI_Period+","+T3_Period+","+T3_Curvature+") ("+TimeFrameStr+")");

  }
//----
   return(0);


//+------------------------------------------------------------------+
//| MTF T3 RSI                                                       |
//+------------------------------------------------------------------+
int start()
  {
   datetime TimeArray[];
   int    i,limit,y=0,counted_bars=IndicatorCounted();

// Plot defined time frame on to current time frame
   ArrayCopySeries(TimeArray,MODE_TIME,Symbol(),TimeFrame);

   limit=Bars;
   for( i=limit; i>=0; i--)
   {
   if (Time[i]<TimeArray[y]) y++;

/***********************************************************
   Add your main indicator loop below.  You can reference an existing
      indicator with its iName  or iCustom.
   Rule 1:  Add extern inputs above for all neccesary values
   Rule 2:  Use 'TimeFrame' for the indicator time frame
   Rule 3:  Use 'y' for your indicator's shift value
 **********************************************************/

   rsiArray[i] = iRSI(NULL,0,T3_Period,PRICE_CLOSE,i);

e1 = w1*rsiArray[i] + w2*e1;
e2 = w1*e1 + w2*e2;
e3 = w1*e2 + w2*e3;
e4 = w1*e3 + w2*e4;
e5 = w1*e4 + w2*e5;
e6 = w1*e5 + w2*e6;

t3Array[i]=c1*e6 + c2*e5 + c3*e4 + c4*e3;
}
//----
return(0);
}
//+------------------------------------------------------------------+
Sample
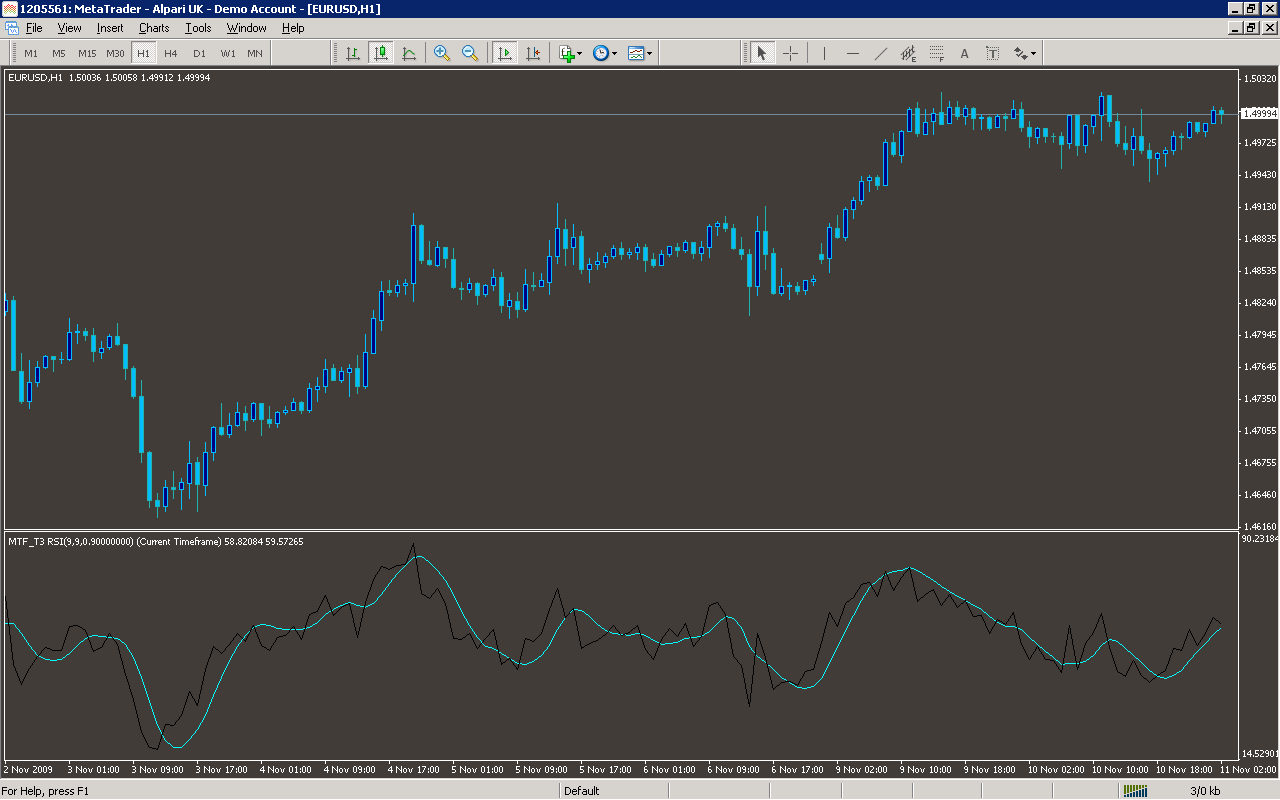
Analysis
Market Information Used:
Series array that contains open time of each bar
Indicator Curves created:
Implements a curve of type DRAW_LINE
Indicators Used:
Relative strength index
Custom Indicators Used:
Order Management characteristics:
Other Features: