//+------------------------------------------------------------------+
//|                                                    NRTR WATR.mq4 |
//|                                                                  |
//|                                        Ramdass - Conversion only |
//+------------------------------------------------------------------+

#property indicator_chart_window
#property indicator_buffers 2
#property indicator_color1 Tomato
#property indicator_color2 DeepSkyBlue
//---- input parameters
extern int AveragePeriod=10;
extern int Variant=2;
extern int CountBars=300;

//---- buffers
double value1[];
double value2[];
//+------------------------------------------------------------------+
//| Custom indicator initialization function                         |
//+------------------------------------------------------------------+
int init()
  {

//---- indicator line
   IndicatorBuffers(4);
   SetIndexStyle(0,DRAW_HISTOGRAM,0,2);//SetIndexStyle(0,DRAW_ARROW);
   //SetIndexArrow(0,167);
   SetIndexStyle(1,DRAW_HISTOGRAM,0,2);//SetIndexStyle(1,DRAW_ARROW);
   //SetIndexArrow(1,167);
   SetIndexStyle(2,DRAW_HISTOGRAM,0,2);
   SetIndexStyle(3,DRAW_HISTOGRAM,0,2);
   SetIndexBuffer(0,value1);
   SetIndexBuffer(1,value2);
//----
//----
   return(0);
  }
//+------------------------------------------------------------------+
//| NRTR WATR                                                        |
//+------------------------------------------------------------------+
int start()
  {
   if (CountBars>=Bars) CountBars=Bars - AveragePeriod - 2;
//   CountBars = CountBars - AveragePeriod - 3;
   SetIndexDrawBegin(0,Bars-CountBars+1);
   SetIndexDrawBegin(1,Bars-CountBars+1);
   int i,i2,bar,counted_bars=IndicatorCounted();
   double value,WATR;
   double trend=1,dK,AvgRange,price,AveragePeriod_D;
   AveragePeriod_D=AveragePeriod;
//----
   if(Bars<=AveragePeriod) return(0);
//---- initial zero
   if(counted_bars<1)
   {
      for(i=1;i<=AveragePeriod;i++) value1[Bars-i]=0.0;
      for(i=1;i<=AveragePeriod;i++) value2[Bars-i]=0.0;
   }
AvgRange=0;

if ((Variant == 2) || (Variant == 3))
   {
   for (i=AveragePeriod; i>=1; i--)
       {
       dK = 1+(AveragePeriod_D-i)/AveragePeriod_D;
       AvgRange=AvgRange + dK*MathAbs(High[i]-Low[i]);
       }
   if (Symbol()=="USDJPY" || Symbol()=="GBPJPY" || Symbol()=="EURJPY")
   {WATR = AvgRange/AveragePeriod_D/100;}
   else
   {WATR = AvgRange/AveragePeriod_D;}
   }


if (Variant == 1)
   {
   for (i=1; i<=AveragePeriod; i++)
       {
       dK = 1+(AveragePeriod_D-i)/AveragePeriod_D;
       AvgRange=AvgRange + dK*MathAbs(High[CountBars + i]-Low[CountBars + i]);
       }
   WATR = AvgRange/AveragePeriod_D;
   }

if (Close[CountBars-1] > Open[CountBars-1])
   {
   value1[CountBars - 1] = Close[CountBars - 1] * (1 - WATR);
   trend = 1; value2[CountBars - 1] = 0.0;
   }

if (Close[CountBars-1] < Open[CountBars-1])
   {
   value2[CountBars - 1] = Close[CountBars - 1] * (1 + WATR);
   trend = -1; value1[CountBars - 1] = 0.0;
   }

//----
   bar=CountBars;
   while(bar>=0)
     {
value1[bar]=0.0; value2[bar]=0.0;

    if (Variant == 3)
    {
        AvgRange=0;
        for (i=1; i<=AveragePeriod; i++)
            {
            dK = 1+(AveragePeriod_D-i)/AveragePeriod_D;
            AvgRange=AvgRange+ dK*MathAbs(High[bar + i]-Low[bar + i]);
            }
        WATR = AvgRange/AveragePeriod_D;
    }
    if (trend == 1)
      {
       if (Close[bar] > price) price = Close[bar];
       value = price * (1 - WATR);
       if (Close[bar] < value)
         {
          price = Close[bar];
          value = price * (1 + WATR);
          trend = -1;
          }
       }
    if (trend == -1)
      {
       if (Close[bar] < price) price = Close[bar];
       value = price * (1 + WATR);
       if (Close[bar] > value)
          {
          price = Close[bar];
          value = price * (1 - WATR);
          trend = 1;
          }
       }

if (trend == 1)  {value1[bar]=Low[bar]; value2[bar]=High[bar];}//if (trend == 1)  {value1[bar]=value; value2[bar]=0.0;}
if (trend == -1)  {value2[bar]=Low[bar]; value1[bar]=High[bar];}//if (trend == -1)  {value2[bar]=value; value1[bar]=0.0;}

      bar--;
     }
   return(0);
  }
//+------------------------------------------------------------------+
Sample
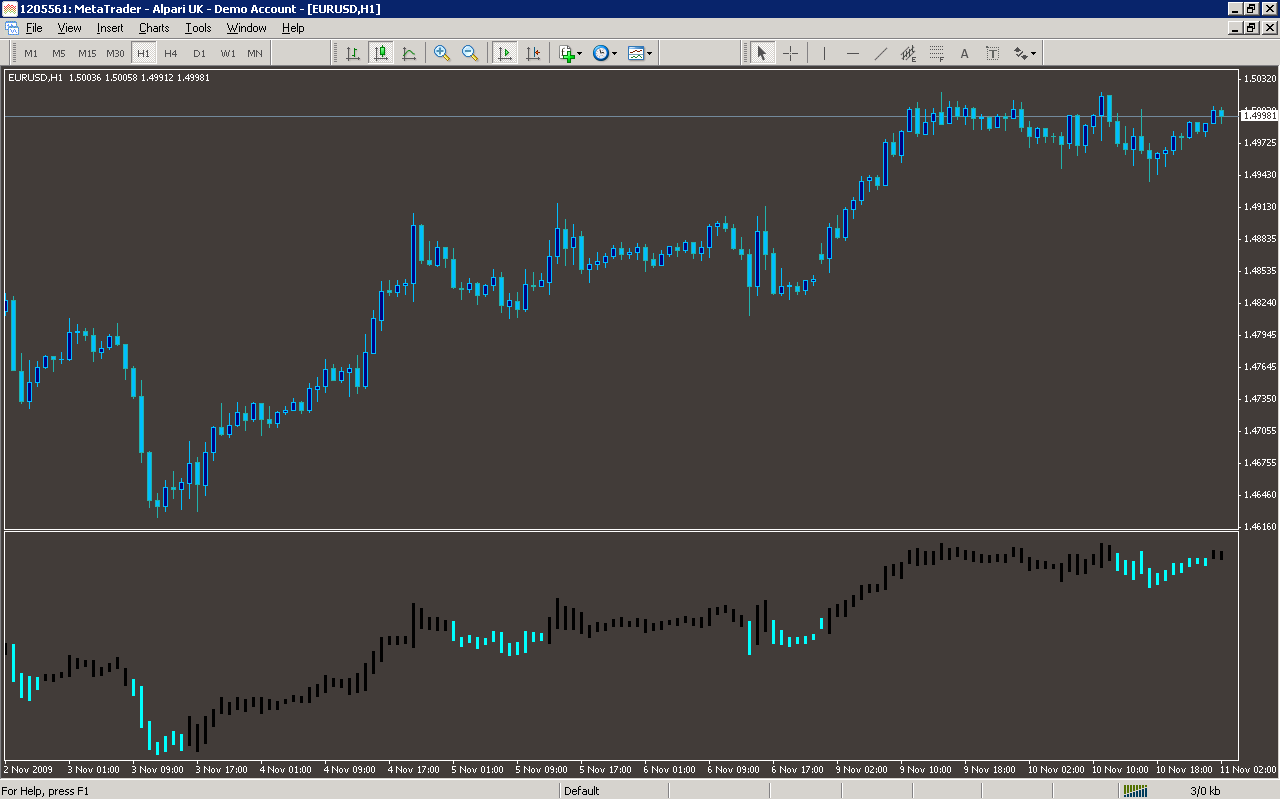
Analysis
Market Information Used:
Series array that contains the highest prices of each bar
Series array that contains the lowest prices of each bar
Series array that contains close prices for each bar
Series array that contains open prices of each bar
Indicator Curves created:
Implements a curve of type DRAW_HISTOGRAM
Indicators Used:
Custom Indicators Used:
Order Management characteristics:
Other Features: