//+------------------------------------------------------------------+
//|                                                    NRTR Dots.mq4 |
//|                                     Copyright © 2006, Nick Bilak |
//+------------------------------------------------------------------+
#property copyright "Copyright © 2006, Nick Bilak"

//---- indicator settings
#property  indicator_chart_window
#property  indicator_buffers 2
#property  indicator_color1  Aqua
#property  indicator_color2  Magenta
//---- indicator parameters
extern int AveragePeriod=21;
//---- indicator buffers
double e1[];
double e2[];

int i,bar,trend=1;
double value,price,dK,AvgRange;

//+------------------------------------------------------------------+
//| Custom indicator initialization function                         |
//+------------------------------------------------------------------+
int init()
  {
//---- drawing settings
   SetIndexStyle(0,DRAW_ARROW);
   SetIndexArrow(0,159);
   SetIndexStyle(1,DRAW_ARROW);
   SetIndexArrow(1,159);
   SetIndexEmptyValue(0,0);
   SetIndexEmptyValue(1,0);
   SetIndexBuffer(0,e1);
   SetIndexBuffer(1,e2);
//---- name for DataWindow and indicator subwindow label
   IndicatorShortName("NRTR_Dots("+AveragePeriod+")");
//---- initialization done
   return(0);

  }

int start()  {

   int counted_bars=IndicatorCounted();
   if(counted_bars<0) return(-1);
   if(counted_bars>0) counted_bars--;
   int limit=Bars-20-counted_bars;
   double spread=Ask-Bid;
   double ap;
   ap=AveragePeriod;
   for(bar=limit; bar>=0; bar--) {
       e1[bar]=0; e2[bar]=0;
       AvgRange=0;
       for (i=bar; i<bar+AveragePeriod; i++) {
          AvgRange=AvgRange+MathAbs(spread+High[bar]-Low[bar]);
       }
       dK = AvgRange/ap;
       if (Close[bar]>10) dK=dK/100.0;
       if (trend == 1) {
          if (Close[bar] > price) price = Close[bar];
          value = price - dK;
          if (Close[bar] < value) {
             price = Close[bar];
             value = price + dK;
             trend = -1;
          }
       }
       if (trend == -1) {
          if (Close[bar] < price) price = Close[bar];
          value = price + dK;
          if (Close[bar] > value) {
             price = Close[bar];
             value = price - dK;
             trend = 1;
          }
       }
      if (trend == -1) e1[bar]=value; //SetIndexValue(bar, value);
      if (trend == 1) e2[bar]=value; //SetIndexValue2(bar, value);
   }
}
Sample
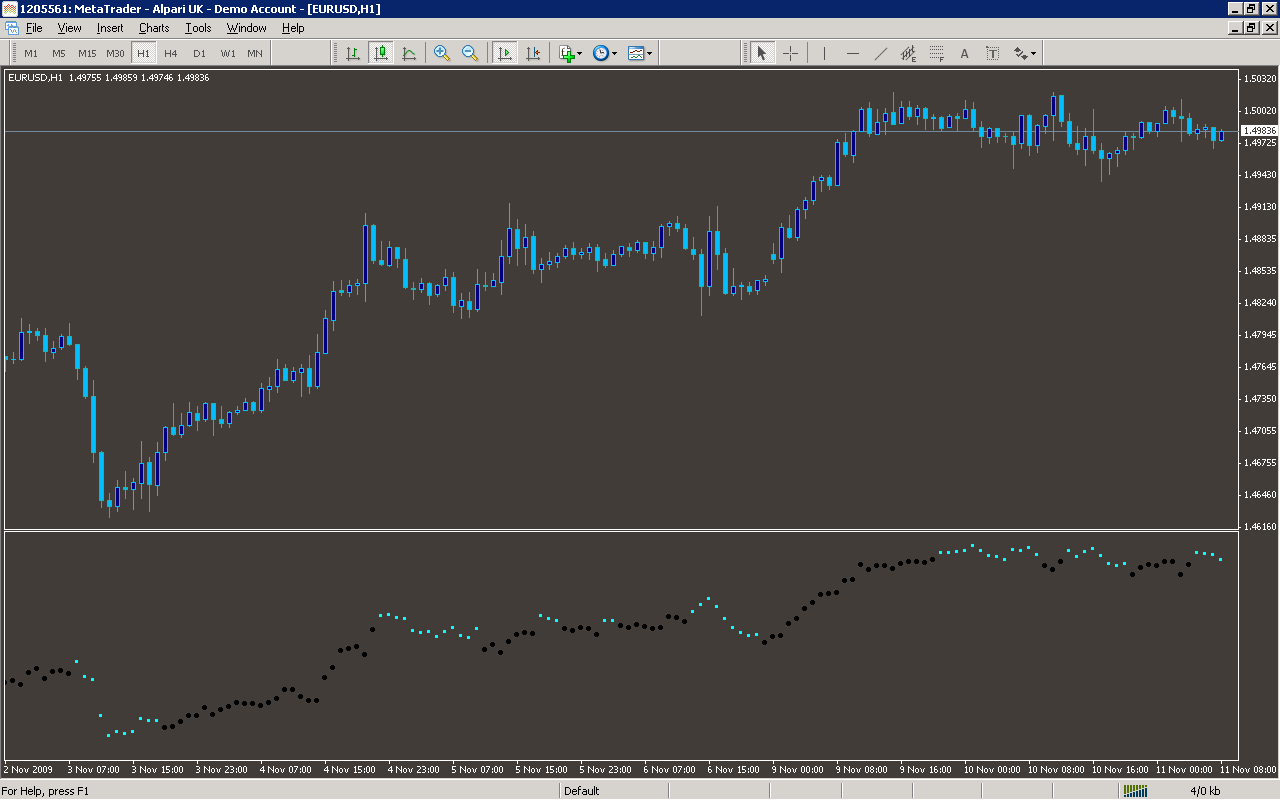
Analysis
Market Information Used:
Series array that contains the highest prices of each bar
Series array that contains the lowest prices of each bar
Series array that contains close prices for each bar
Indicator Curves created:
Implements a curve of type DRAW_ARROW
Indicators Used:
Custom Indicators Used:
Order Management characteristics:
Other Features: