//+------------------------------------------------------------------+
//|                                        OzFX Daily Signals v1.mq4 |
//|                                            Copyright © 2008, DGC |
//|                                          http://www.ozfx.com.au/ |
//+------------------------------------------------------------------+
#property copyright "Copyright © 2008, DGC"
#property link      "http://www.ozfx.com.au/"

#property indicator_separate_window
#property indicator_buffers 3
#property indicator_color1 Yellow
#property indicator_width1 2
#property indicator_color2 DodgerBlue
#property indicator_width2 2
#property indicator_color3 Red
#property indicator_width3 2
#property indicator_level1 0
#property indicator_minimum -1.2
#property indicator_maximum 1.2

double OzFX_Regular[];
double OzFX_AdvancedEntry[];
double Filter_200SMA[];

int iLastRegular;
int k;

int init()
{
   SetIndexStyle(0,DRAW_HISTOGRAM);
   SetIndexBuffer(0,OzFX_Regular);
   SetIndexStyle(1,DRAW_HISTOGRAM);
   SetIndexBuffer(1,OzFX_AdvancedEntry);
   SetIndexStyle(2,DRAW_LINE);
   SetIndexBuffer(2,Filter_200SMA);
   iLastRegular = 0;
   return(0);
}

int start()
{
   for (k = Bars - 205; k >= 0; k --)
   {
      OzFX_Regular[k] = 0;
      if (iAC(Symbol(), 0, k) > 0 &&
          iAC(Symbol(), 0, k) > iAC(Symbol(), 0, k + 1) &&
          iStochastic(Symbol(), 0, 5, 3, 3, MODE_SMA, 0, MODE_MAIN, k) > 50)
      {
         if (iLastRegular != 1) OzFX_Regular[k] = 1;
         iLastRegular = 1;
      }

      if (iAC(Symbol(), 0, k) < 0 &&
          iAC(Symbol(), 0, k) < iAC(Symbol(), 0, k + 1) &&
          iStochastic(Symbol(), 0, 5, 3, 3, MODE_SMA, 0, MODE_MAIN, k) < 50)
      {
         if (iLastRegular != -1) OzFX_Regular[k] = -1;
         iLastRegular = -1;
      }

      Filter_200SMA[k] = 0;
      if (Close[k] > iMA(Symbol(), 0, 200, 0, MODE_SMA, PRICE_CLOSE, k))
         Filter_200SMA[k] = 1;
      if (Close[k] < iMA(Symbol(), 0, 200, 0, MODE_SMA, PRICE_CLOSE, k))
         Filter_200SMA[k] = -1;
   }
//      double val=iAO(NULL, 0, 2);

   return(0);
}
Sample
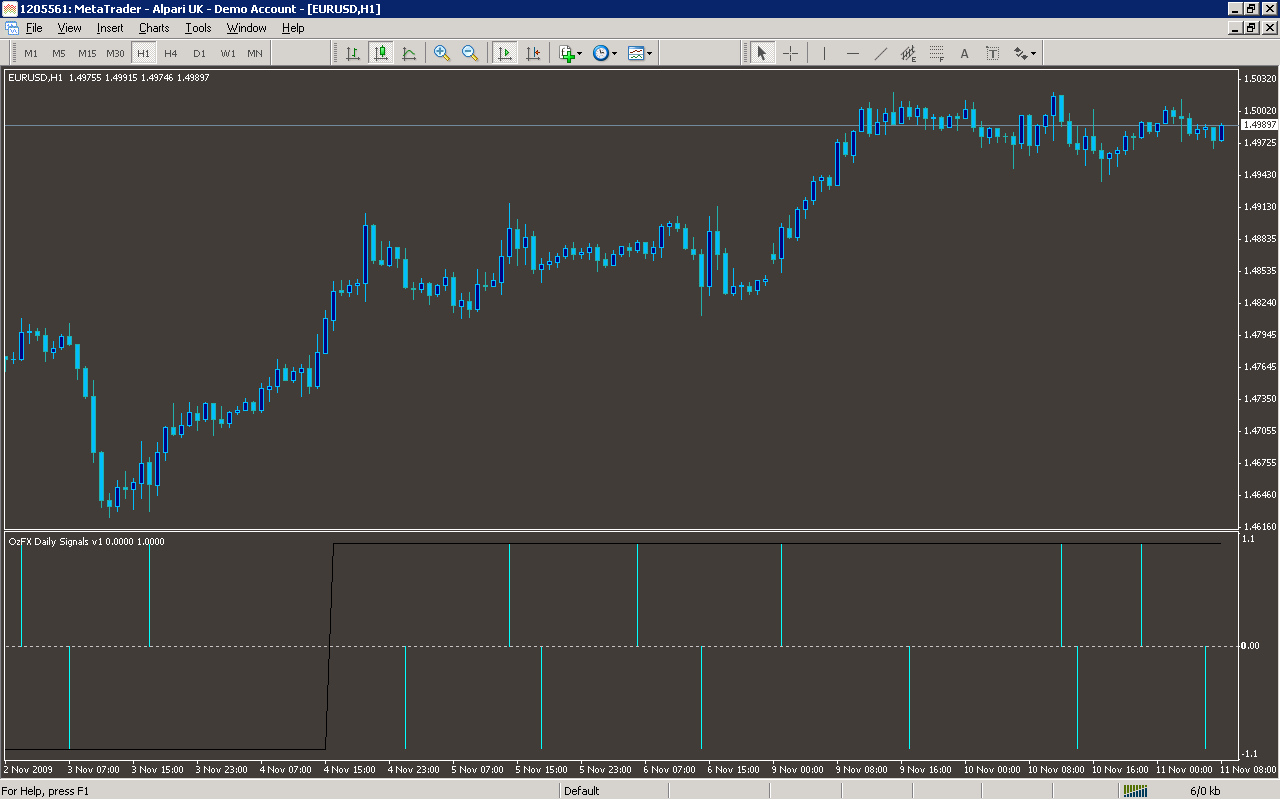
Analysis
Market Information Used:
Series array that contains close prices for each bar
Indicator Curves created:
Implements a curve of type DRAW_HISTOGRAM
Implements a curve of type DRAW_LINE
Indicators Used:
Bill Williams Accelerator/Decelerator oscillator
Stochastic oscillator
Moving average indicator
Custom Indicators Used:
Order Management characteristics:
Other Features: