//+------------------------------------------------------------------+
//|                PercentR - PCR.mq4                                |
//|                Copyright © 2006  Scorpion@fxfisherman.com        |
//+------------------------------------------------------------------+
#property copyright "FxFisherman.com"
#property link      "http://www.fxfisherman.com"

#property indicator_separate_window
#property indicator_buffers 1
#property indicator_color1 Lime
#property indicator_level1 80
#property indicator_level2 20

extern int HL_Period=20;
extern int Shift_Bars=0;
extern int Bars_Count= 1000;

//---- buffers
double v1[];
double val1;

int init()
  {

   IndicatorBuffers(1);

   SetIndexStyle(0,DRAW_LINE,STYLE_SOLID,1);
   SetIndexDrawBegin(0,-1);
   SetIndexBuffer(0, v1);
   SetIndexLabel(0,"PCR");

   watermark();

   return(0);
  }

int start()
 {
  int i;
  int shift;
  double h, l, p;
  int counted_bars = IndicatorCounted();
  if (counted_bars > 0) counted_bars--;
  if (Bars_Count > 0 && Bars_Count <= Bars)
  {
    i = Bars_Count - counted_bars;
  }else{
    i = Bars - counted_bars;
  }

  while(i>=0)
   {
    shift = i + Shift_Bars;
    h = High[Highest(Symbol(), Period(), MODE_HIGH, HL_Period, shift + 1)];
    l = Low[Lowest(Symbol(), Period(), MODE_LOW, HL_Period, shift + 1)];
    p = Close[shift];
    if (h > 0 && p > 0 && l > 0)
    {
        v1[i] = ((p-l)/(h-l))*100;
//      v1[i] = ((h-p)/(h-l))*100;
    }
    i--;
   }
  return(0);
 }

//+------------------------------------------------------------------+

void watermark()
  {
   ObjectCreate("fxfisherman", OBJ_LABEL, 0, 0, 0);
   ObjectSetText("fxfisherman", "fxfisherman.com", 11, "Lucida Handwriting", RoyalBlue);
   ObjectSet("fxfisherman", OBJPROP_CORNER, 2);
   ObjectSet("fxfisherman", OBJPROP_XDISTANCE, 5);
   ObjectSet("fxfisherman", OBJPROP_YDISTANCE, 10);
   return(0);
  }
Sample
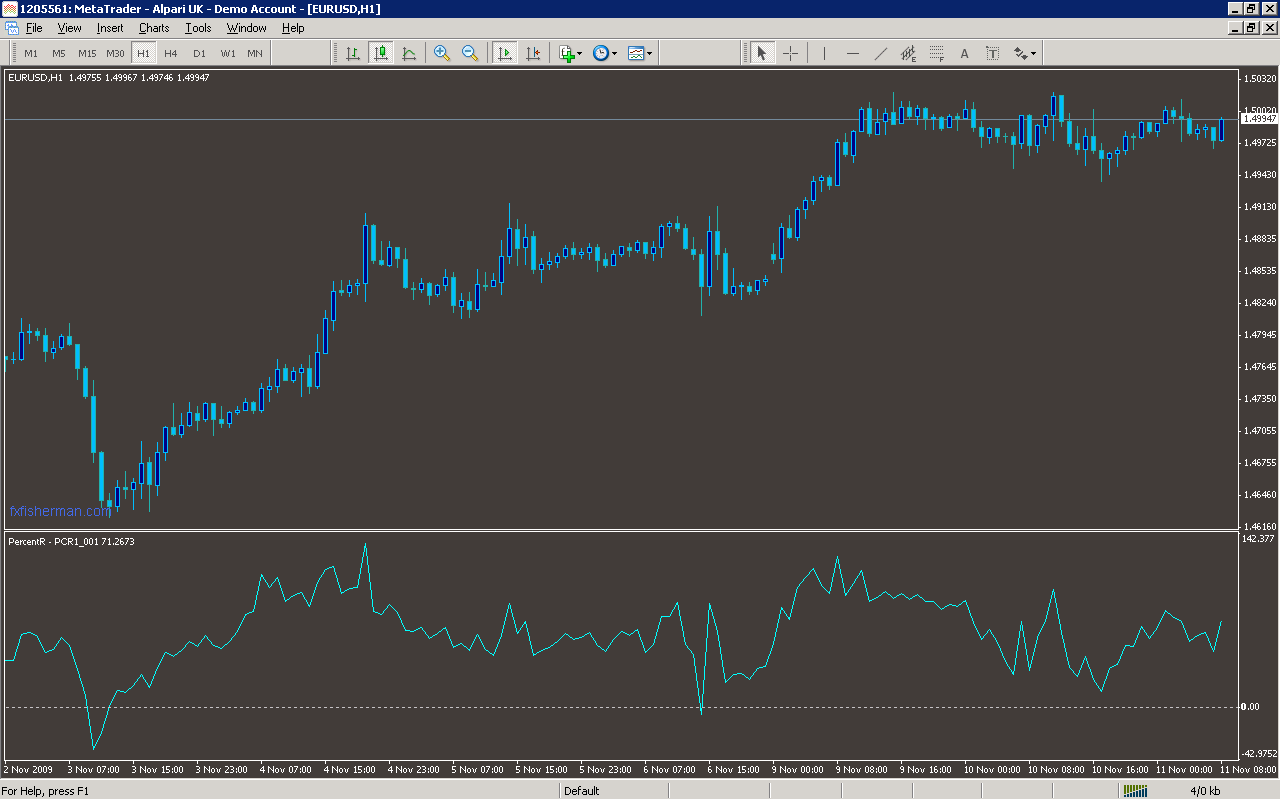
Analysis
Market Information Used:
Series array that contains the highest prices of each bar
Series array that contains the lowest prices of each bar
Series array that contains close prices for each bar
Indicator Curves created:
Implements a curve of type DRAW_LINE
Indicators Used:
Custom Indicators Used:
Order Management characteristics:
Other Features: