//+------------------------------------------------------------------+
//|                                                 Pivot Points.mq4 |
//|                                                          Akuma99 |
//|                                                                  |
//+------------------------------------------------------------------+
#property copyright "Akuma99"
#property link      ""

#property indicator_chart_window
#property indicator_buffers 7
#property indicator_color1 DarkGreen
#property indicator_color2 Green
#property indicator_color3 YellowGreen
#property indicator_color4 Navy
#property indicator_color5 Maroon
#property indicator_color6 Orange
#property indicator_color7 Red

double PivotBuffer0[]; //r3
double PivotBuffer1[]; //r2
double PivotBuffer2[]; //r1
double PivotBuffer3[]; //p
double PivotBuffer4[]; //s1
double PivotBuffer5[]; //s2
double PivotBuffer6[]; //s3

int init() {

   SetIndexStyle(0,DRAW_LINE, 0, 2);
   SetIndexBuffer(0,PivotBuffer0);
   SetIndexEmptyValue(0,0.0);
   SetIndexLabel(0,"Resistance 3");
   SetIndexStyle(1,DRAW_LINE, 0, 2);
   SetIndexBuffer(1,PivotBuffer1);
   SetIndexEmptyValue(1,0.0);
   SetIndexLabel(1,"Resistance 2");
   SetIndexStyle(2,DRAW_LINE, 0, 2);
   SetIndexBuffer(2,PivotBuffer2);
   SetIndexEmptyValue(2,0.0);
   SetIndexLabel(2,"Resistance 1");
   SetIndexStyle(3,DRAW_LINE, 0, 2);
   SetIndexBuffer(3,PivotBuffer3);
   SetIndexEmptyValue(3,0.0);
   SetIndexLabel(3,"Pivot");
   SetIndexStyle(4,DRAW_LINE, 0, 2);
   SetIndexBuffer(4,PivotBuffer4);
   SetIndexEmptyValue(4,0.0);
   SetIndexLabel(4,"Support 1");
   SetIndexStyle(5,DRAW_LINE, 0, 2);
   SetIndexBuffer(5,PivotBuffer5);
   SetIndexEmptyValue(5,0.0);
   SetIndexLabel(5,"Support 2");
   SetIndexStyle(6,DRAW_LINE, 0, 2);
   SetIndexBuffer(6,PivotBuffer6);
   SetIndexEmptyValue(6,0.0);
   SetIndexLabel(6,"Support 3");
   return(0);

}

int start() {

   int counted_bars = IndicatorCounted();
   double yHigh, yLow, yClose, p, r3, r2, r1, s3, s2, s1;
   int limit=Bars-counted_bars;

   yHigh = iHigh(NULL, PERIOD_D1, 1);
   yLow = iLow(NULL, PERIOD_D1, 1);
   yClose = iClose(NULL, PERIOD_D1, 1);

   p = (yHigh+yLow+yClose)/3;
   r1 = 2*p-yLow;
   s1 = 2*p-yHigh;
   s2 = p-(r1-s1);
   r2 = p+(r1-s1);
   s3 = 2*p - (2 * yHigh - yLow);
   r3 = 2*p + (yHigh - 2 * yLow);

   for(int i=0; i<limit; i++) {
      PivotBuffer0[i] = r3;
      PivotBuffer1[i] = r2;
      PivotBuffer2[i] = r1;
      PivotBuffer3[i] = p;
      PivotBuffer4[i] = s1;
      PivotBuffer5[i] = s2;
      PivotBuffer6[i] = s3;
   }

   return(0);

}
Sample
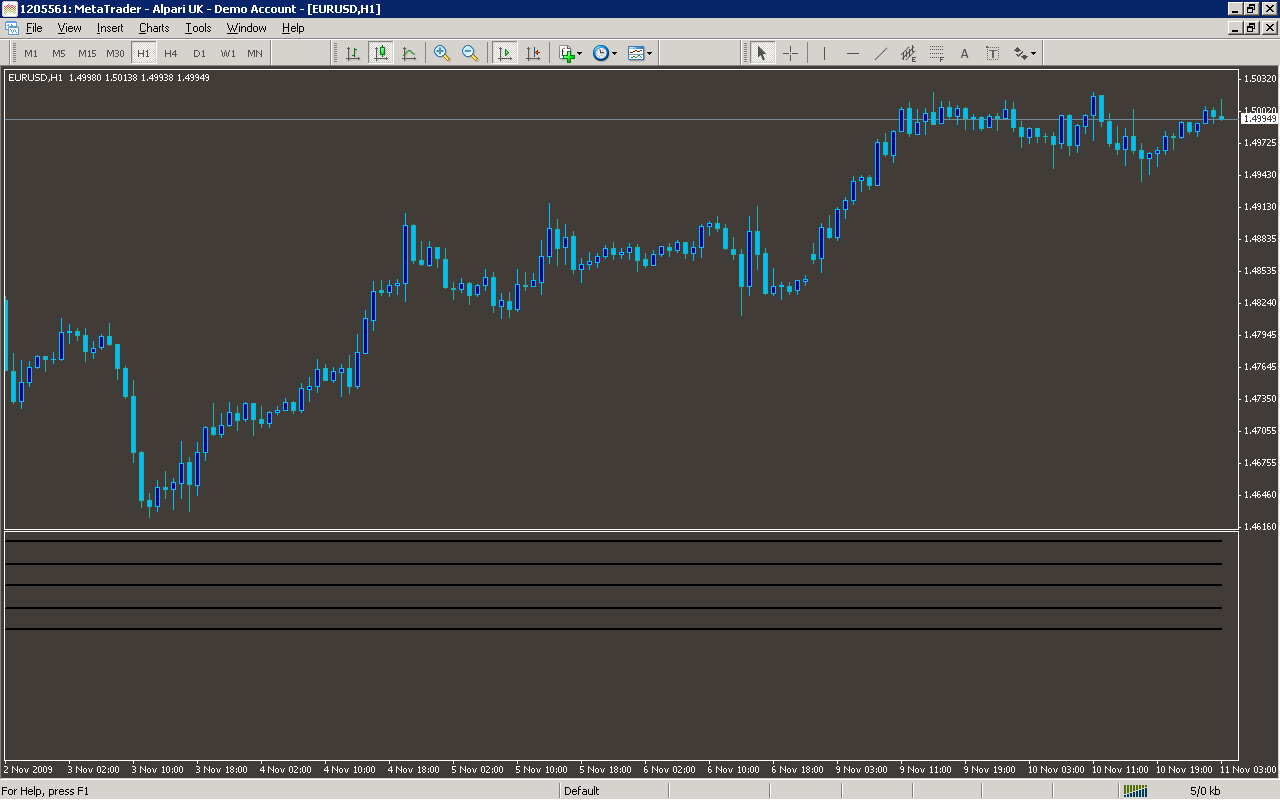
Analysis
Market Information Used:
Series array that contains the highest prices of each bar
Series array that contains the lowest prices of each bar
Series array that contains close prices for each bar
Indicator Curves created:
Implements a curve of type DRAW_LINE
Indicators Used:
Custom Indicators Used:
Order Management characteristics:
Other Features: