//+------------------------------------------------------------------+
//|                                                  Pivot_Crazy.mq4 |
//|                                                íàä êîäîì Profi_R |
//|                                              ãëóìèëñÿ Dm_35 2008 |
//|                                    http://www.fxexpert.ru/forum/ |
//+------------------------------------------------------------------+
#property copyright "Dm_35"
#property link      "dm34@mail.ru"

#property indicator_chart_window
#property indicator_buffers 7
#property indicator_color1 Navy
#property indicator_color2 Yellow
#property indicator_color3 Yellow
#property indicator_color4 Red
#property indicator_color5 Yellow
#property indicator_color6 Yellow
#property indicator_color7 Red
//---- input parameters
extern int       T_F=480;
extern int       limit=400;
extern int       lm=0;
//---- buffers
double R3Buffer[];
double R2Buffer[];
double R1Buffer[];
double PBuffer[];
double S1Buffer[];
double S2Buffer[];
double S3Buffer[];


//----
int Displacement;

//+------------------------------------------------------------------+
//| Custom indicator initialization function                         |
//+------------------------------------------------------------------+
int init()
  {
//---- indicators
   IndicatorBuffers(7);
   SetIndexStyle(1,DRAW_LINE,0);
   SetIndexStyle(2,DRAW_LINE,0);
   SetIndexStyle(3,DRAW_LINE,0);
   SetIndexStyle(4,DRAW_LINE,0);
   SetIndexStyle(5,DRAW_LINE,0);
   SetIndexStyle(6,DRAW_LINE,0);
   SetIndexBuffer(1,R1Buffer);
   SetIndexBuffer(2,R2Buffer);
   SetIndexBuffer(3,R3Buffer);
   SetIndexBuffer(4,S1Buffer);
   SetIndexBuffer(5,S2Buffer);
   SetIndexBuffer(6,S3Buffer);

   SetIndexStyle(0,DRAW_LINE,STYLE_SOLID,2);
   SetIndexBuffer(0,PBuffer);
   if( lm==0)
         Displacement=T_F/Period();
      else
         Displacement=1;

SetIndexShift(0,Displacement);
SetIndexShift(1,Displacement);
SetIndexShift(2,Displacement);
SetIndexShift(3,Displacement);
SetIndexShift(4,Displacement);
SetIndexShift(5,Displacement);
SetIndexShift(6,Displacement);
//----
   return(0);
  }
//+------------------------------------------------------------------+
//| Custom indicator iteration function                              |
//+------------------------------------------------------------------+
int start()
  {
   int cb,sbb_index,sbb_Aux_i,sbe_Aux_i,i;
   int counted_bars=IndicatorCounted();
   datetime Corresp_bbbnTime;
   double StHigh,StLow,DHigh,DLow,SStaticStep,SDBStep;

   for(cb=limit;cb>=0;cb--)
   {
      Corresp_bbbnTime=NormTimeBarBegin(Time[cb],T_F);
      sbb_index=n_iBarShift(Corresp_bbbnTime,Period());

      StHigh=High[iHighest(NULL,0,MODE_HIGH,sbb_index-cb+1,cb)];
      StLow=Low[iLowest(NULL,0,MODE_LOW,sbb_index-cb+1,cb)];

      PBuffer[cb]=MathRound((Close[cb]+StHigh+StLow)/3/Point)*Point;

      if( cb<sbb_index )
      {
         for(i=cb+1;i<=sbb_index;i++)
         {
            PBuffer[i]=PBuffer[cb];
            R1Buffer[i]=(2*PBuffer[i])-StLow;
            R2Buffer[i]=PBuffer[cb]+(StHigh - StLow);
            R3Buffer[i]=(2*PBuffer[cb])+(StHigh-(2*StLow));
            S1Buffer[i]=(2*PBuffer[i])-StHigh;
            S2Buffer[i]=PBuffer[cb]-(StHigh - StLow);
            S3Buffer[i]=(2*PBuffer[cb])-((2* StHigh)-StLow);
         }
      }


   }

//-----------------
   return(0);
  }
//-----------------
datetime NormTimeBarBegin(datetime intime, int TF)
  {
   datetime outtime;
   if(TF!=10080)
   {
      outtime=MathFloor(intime/TF/60)*TF*60;
   }
   else
   {
      outtime=MathFloor((intime+345600)/TF/60)*TF*60-345600;
   }
   return(outtime);
  }
//-----------------
int n_iBarShift(datetime intime, int TF)
  {
   int bindex,b_count;
   datetime TArray[];
   b_count=ArrayCopySeries(TArray,MODE_TIME,Symbol(),TF);
   bindex=ArrayBsearch(TArray,NormTimeBarBegin(intime,TF),0,0,MODE_ASCEND) ;
   return(bindex);
  }
//-----------------
Sample
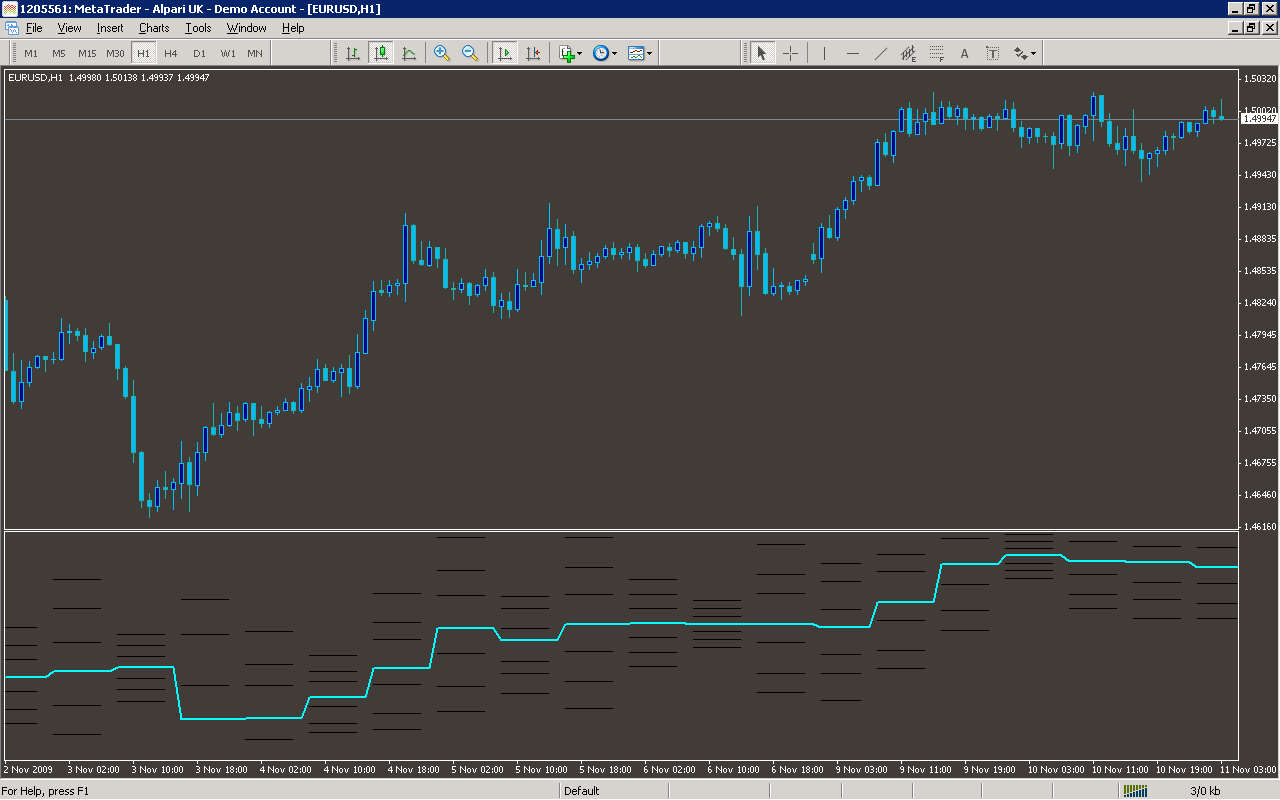
Analysis
Market Information Used:
Series array that contains open time of each bar
Series array that contains the highest prices of each bar
Series array that contains the lowest prices of each bar
Series array that contains close prices for each bar
Indicator Curves created:
Implements a curve of type DRAW_LINE
Indicators Used:
Custom Indicators Used:
Order Management characteristics:
Other Features: