//+------------------------------------------------------------------+
//|                                                   Pivot_only_H1.mq4 |
//|                                                   upgrade by Darkkiller |
//|                      Copyright © 2006, MetaQuotes Software Corp. |
//|                                        http://www.metaquotes.net |
//+------------------------------------------------------------------+
//+------------------------------------------------------------------+
//|                                                 AllPivots_v1.mq4 |
//|                                  Copyright © 2006, Forex-TSD.com |
//|                         Written by IgorAD,igorad2003@yahoo.co.uk |
//|            http://finance.groups.yahoo.com/group/TrendLaboratory |
//+------------------------------------------------------------------+
#property copyright "Copyright © 2006, Forex-TSD.com "
#property link      "http://www.forex-tsd.com/"

#property indicator_chart_window

extern int  CountDays=1000;


   datetime time1;
   datetime time2;
   double open,close,high,low;
   double P;

   int shift, num;

   void ObjDel()
   {
      for (;num<=CountDays;num++)
      {
      ObjectDelete("Pivot H1["+num+"]");

      }
   }

   void PlotLine(string name,double value,double line_color,double style)
   {
   ObjectCreate(name,OBJ_TREND,0,time1,value,time2,value);
   ObjectSet(name, OBJPROP_WIDTH, 2);
   ObjectSet(name, OBJPROP_STYLE, style);
   ObjectSet(name, OBJPROP_RAY, false);
   ObjectSet(name, OBJPROP_BACK, true);
   ObjectSet(name, OBJPROP_COLOR, line_color);
    }
int init()
  {

  return(0);
  }


int deinit()
  {
   ObjDel();
   Comment("");
   return(0);
  }

int start()
  {
  int i;

  ObjDel();
  num=0;

  for (shift=CountDays-1;shift>=0;shift--)
  {
  time1=iTime(NULL,PERIOD_H1,shift);
  i=shift-1;
  if (i<0)
  time2=Time[0];
  else
  time2=iTime(NULL,PERIOD_H1,i)-Period()*60;

  high  = iHigh(NULL,PERIOD_H1,shift+1);
  low   = iLow(NULL,PERIOD_H1,shift+1);
  close = iClose(NULL,PERIOD_H1,shift+1);

  P  = (high+low+close)/3.0;


  time2=time1+PERIOD_H1*60;


  num=shift;

  PlotLine("Pivot H1["+num+"]",P,Yellow,0);

  }
   return(0);
  }
//+------------------------------------------------------------------+
Sample
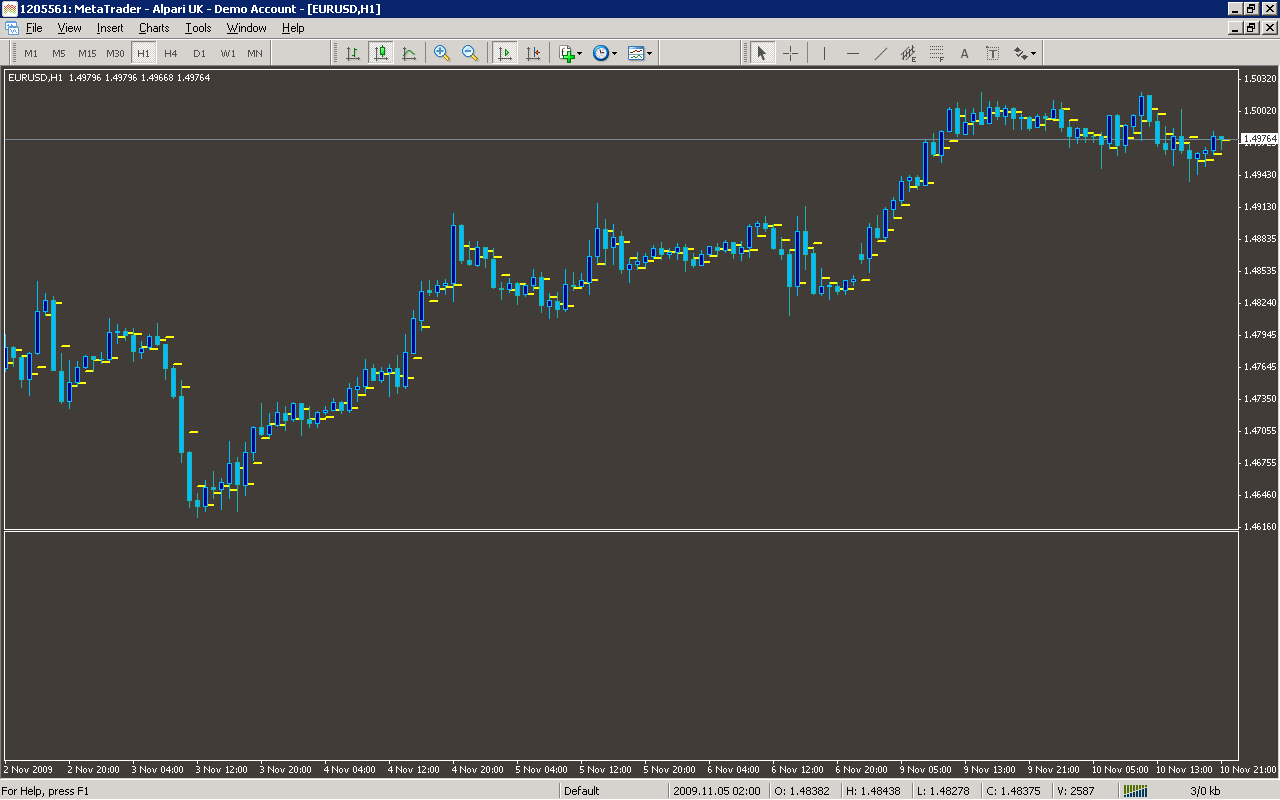
Analysis
Market Information Used:
Series array that contains open time of each bar
Series array that contains the highest prices of each bar
Series array that contains the lowest prices of each bar
Series array that contains close prices for each bar
Indicator Curves created:
Indicators Used:
Custom Indicators Used:
Order Management characteristics:
Other Features: