//+------------------------------------------------------------------+
//|                                                  Pj-over RSI.mq4 |
//|                                      Copyright © 2007, PRIMAjaya |
//|                                   http://primaforex.blogspot.com |
//+------------------------------------------------------------------+
#property copyright "Copyright © 2007, PRIMAjaya"
#property link      "http://primaforex.blogspot.com"

#property indicator_separate_window
#property indicator_minimum 0
#property indicator_maximum 1
#property indicator_buffers 4
#property indicator_color1 DarkGreen
#property indicator_color2 Red
#property indicator_color3 MediumSeaGreen
#property indicator_color4 Tomato


//---- input parameters
extern int PeriodeRSI=17;
extern int OverboughtLevel=70;
extern int OversoldLevel=30;

//---- indicator buffers
double UpBuffer1[];
double DnBuffer1[];
double UpBuffer2[];
double DnBuffer2[];
//+------------------------------------------------------------------+
//| Custom indicator initialization function                         |
//+------------------------------------------------------------------+
  int init()
  {
   string indi_name;
//---- indicator line
   SetIndexStyle(0,DRAW_HISTOGRAM,STYLE_SOLID,2);
   SetIndexStyle(1,DRAW_HISTOGRAM,STYLE_SOLID,2);
   SetIndexStyle(2,DRAW_HISTOGRAM,STYLE_SOLID,2);
   SetIndexStyle(3,DRAW_HISTOGRAM,STYLE_SOLID,2);

   SetIndexBuffer(0,UpBuffer1);
   SetIndexBuffer(1,DnBuffer1);
   SetIndexBuffer(2,UpBuffer2);
   SetIndexBuffer(3,DnBuffer2);

   IndicatorDigits(MarketInfo(Symbol(),MODE_DIGITS));
//---- name for DataWindow and indicator subwindow label
   indi_name="Pj-overRSI("+PeriodeRSI+")";
   IndicatorShortName(indi_name);
   SetIndexLabel(0,"Overbought or Strong Bulls");
   SetIndexLabel(1,"Oversold or Strong Bears");
   SetIndexLabel(2,"Trend Bulls");
   SetIndexLabel(3,"Trend Bears");

//----
   SetIndexDrawBegin(0,PeriodeRSI);
   SetIndexDrawBegin(1,PeriodeRSI);
   SetIndexDrawBegin(2,PeriodeRSI);
   SetIndexDrawBegin(3,PeriodeRSI);
//----
   return(0);
  }

//+------------------------------------------------------------------+
//| ProSol Confirmation                                              |
//+------------------------------------------------------------------+
int start()
  {
   int shift,trend;
   double RSI0;


   for(shift=Bars-PeriodeRSI-1;shift>=0;shift--)
   {
   RSI0=iRSI(NULL,0,PeriodeRSI,PRICE_CLOSE,shift);

	  if (RSI0>(OverboughtLevel+OversoldLevel)/2 && RSI0<OverboughtLevel)  trend=1;
	  if (RSI0>=OverboughtLevel)  trend=2;
	  if (RSI0<=(OverboughtLevel+OversoldLevel)/2 && RSI0>OversoldLevel) trend=-1;
	  if (RSI0<OversoldLevel)  trend=-2;

	  if (trend==1)
	  {

	  UpBuffer1[shift]=0;
	  UpBuffer2[shift]=1;
	  DnBuffer1[shift]=0;
	  DnBuffer2[shift]=0;

	  }
	  if (trend==2)
	  {

	  UpBuffer1[shift]=1;
	  UpBuffer2[shift]=0;
	  DnBuffer1[shift]=0;
	  DnBuffer2[shift]=0;

	  }
	  if (trend==-1)
	  {

	  UpBuffer1[shift]=0;
	  UpBuffer2[shift]=0;
	  DnBuffer1[shift]=0;
	  DnBuffer2[shift]=1;
	  }

	  if (trend==-2)
	  {

	  UpBuffer1[shift]=0;
	  UpBuffer2[shift]=0;
	  DnBuffer1[shift]=1;
	  DnBuffer2[shift]=0;

	  }
	}
	return(0);
 }
Sample
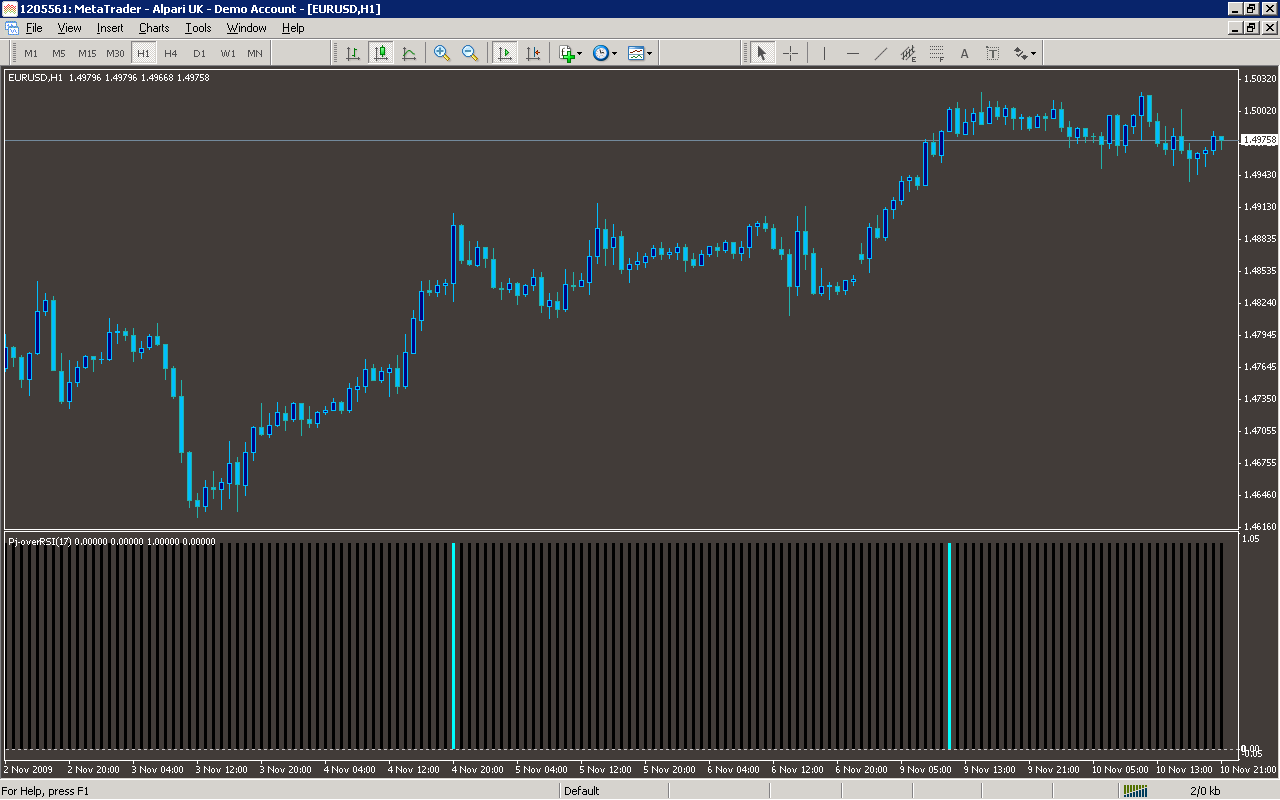
Analysis
Market Information Used:
Indicator Curves created:
Implements a curve of type DRAW_HISTOGRAM
Indicators Used:
Relative strength index
Custom Indicators Used:
Order Management characteristics:
Other Features: