//+------------------------------------------------------------------+
//|                                               ZigZag Pointer.mq4 |
//|                                    zigzag modified by Dr. Gaines |
//|                                      neamtu_victor@yahoo.com     |
//|                                         neamtu victor            |
//+------------------------------------------------------------------+
#property copyright "neamtu victor"
#property link      "neamtu_victor@yahoo.com"

#property indicator_chart_window
#property indicator_buffers 2
#property indicator_color1 Lime
#property indicator_width1 1
#property indicator_color2 Red
#property indicator_width2 1
//---- indicator parameters
extern double Percent=0.2;
//---- indicator buffers
double buyArrowsBuffer[];
double sellArrowsBuffer[];


//+------------------------------------------------------------------+
//| Custom indicator initialization function                         |
//+------------------------------------------------------------------+


int init()
  {
   IndicatorBuffers(2);
//---- drawing settings
   SetIndexStyle(0,DRAW_ARROW);
   SetIndexArrow(0, 233);//233
   SetIndexStyle(1,DRAW_ARROW);
   SetIndexArrow(1, 234);//234

//---- indicator buffers mapping
   SetIndexBuffer(0,buyArrowsBuffer);
   SetIndexBuffer(1,sellArrowsBuffer);
   SetIndexEmptyValue(0,0.0);

   IndicatorShortName("Percentual ZigZag("+Percent+")");

   Percent /= 100;

   return(0);
  }
//+------------------------------------------------------------------+
//|                                                                  |
//+------------------------------------------------------------------+
double barPrice(int shift){
   double auxPrice=0;

   auxPrice=(iOpen(Symbol(),Period(),shift)+iClose(Symbol(),Period(),shift)+iLow(Symbol(),Period(),shift)+iHigh(Symbol(),Period(),shift))/4;

   return(auxPrice);
}


int start(){

   int shift;
   static double value;
/*
   int counted_bars=IndicatorCounted();
   if(counted_bars<0)
      return(-1);

   int limit=Bars-counted_bars-1;
*/

   for(shift=Bars-1; shift>=0; shift--){

      if (shift == Bars-1){
         value=barPrice(Bars-1);
     }
      else{
         //Print(" barPrice: ", barPrice(shift), " value+p.. ", value );
         if (barPrice(shift) > value + Percent*value){
            buyArrowsBuffer[shift]=iLow(Symbol(),Period(),shift)-10*Point;
            sellArrowsBuffer[shift]=0;
            value=value + Percent*value;
            //Print("Bars ",Bars, " Shift ",shift," barPrice: ", value);
         }


         if (barPrice(shift) < value - Percent*value){
            sellArrowsBuffer[shift]=iHigh(Symbol(),Period(),shift)+10*Point;
            buyArrowsBuffer[shift]=0;
            value=value - Percent*value;
            //Print("Bars ",Bars, " Shift ",shift," barPrice: ", value);
         }
  //
     }


   }


}

  //end//
Sample
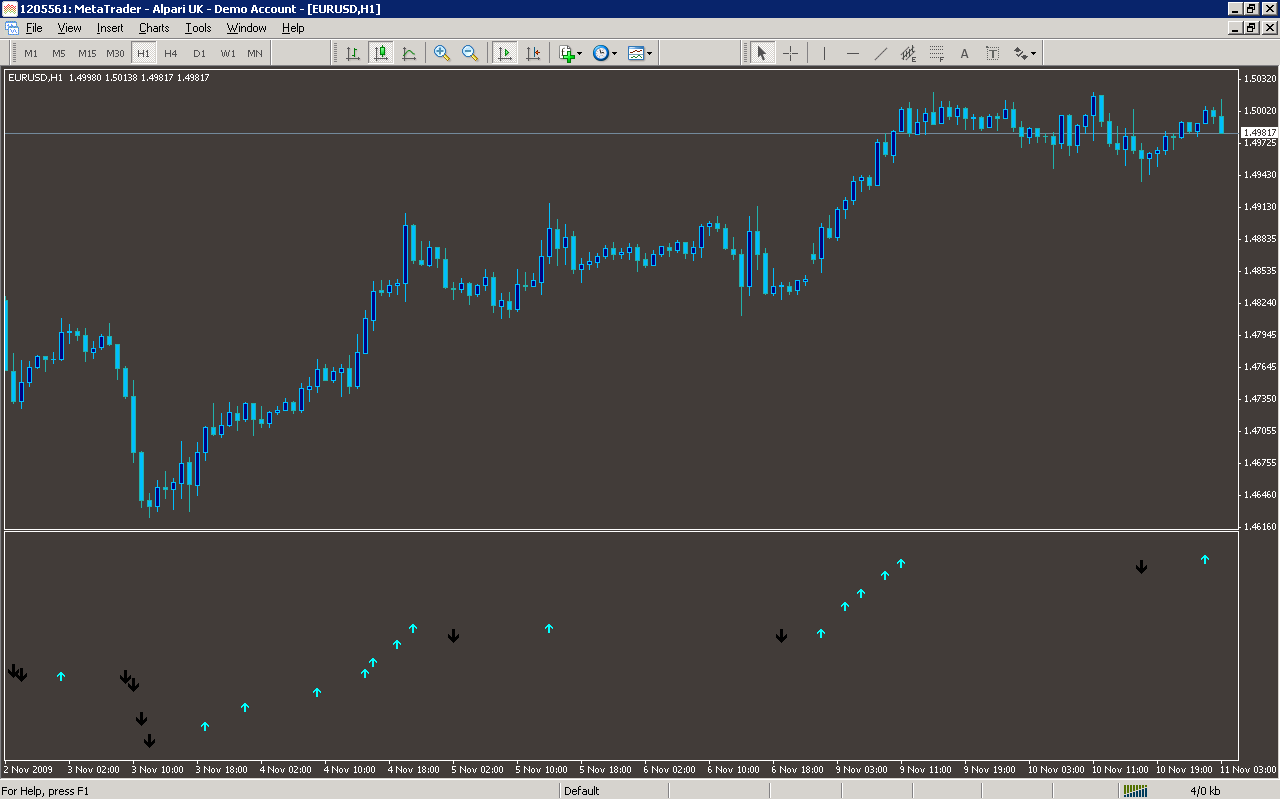
Analysis
Market Information Used:
Series array that contains the highest prices of each bar
Series array that contains the lowest prices of each bar
Series array that contains open prices of each bar
Series array that contains close prices for each bar
Indicator Curves created:
Implements a curve of type DRAW_ARROW
Indicators Used:
Custom Indicators Used:
Order Management characteristics:
Other Features: