//+------------------------------------------------------------------+
//|                                           Price_Distribution.mq4 |
//|                      Copyright © 2006, MetaQuotes Software Corp. |
//|                                        http://www.metaquotes.net |
//+------------------------------------------------------------------+
#property copyright "Copyright © 2006, MetaQuotes Software Corp."
#property link      "http://www.metaquotes.net"

#define      SECONDS_IN_MINUTE   60
#define      SECONDS_IN_HOUR      3600
#define      SECONDS_IN_DAY      86400

#define      OBJNAME_PREPEND      "ValueInRange"

#property indicator_chart_window


extern string   BoxStart         = "10:00";
extern string   BoxEnd            = "23:59";
extern string   LineEnd            = "10:00";
extern double   PlotMagnification   = 300.0;
extern color   BoxColor         = C'17,28,28';
extern color   LineColor         = DarkSlateGray;
extern color   PlotColor         = SlateGray;
extern int      DaysToPlot         = 10;


int init() {
}

int deinit() {
   DeleteObjects(OBJNAME_PREPEND);
   return(0);
}

int start() {

   int iPlots = 0;

   // Determine how far back to iterate
   // Always recalc last complete bar
   int iBarsToCalc = Bars - IndicatorCounted();
   if (iBarsToCalc < Bars) iBarsToCalc++;

   // Determine start time for current (or just closed) box
   datetime dtBoxStart = StrToTime(TimeToStr(TimeCurrent(),TIME_DATE) + " " + BoxStart);
   if (dtBoxStart > TimeCurrent()) dtBoxStart -= SECONDS_IN_DAY;

   // Determine end time for current (or just closed) box
   datetime dtBoxEnd   = StrToTime(TimeToStr(dtBoxStart,TIME_DATE) + " " + BoxEnd);
   if (dtBoxEnd < dtBoxStart) dtBoxEnd += SECONDS_IN_DAY;

   // Simply loop, there are multiple ways to break
   // While the box close time is after the oldest bar which needs calculation,
   // calculate the box then add a day and repeat
   while (true) {

      // If the box close time is before the oldest bar which needs calculation, exit
      if (dtBoxEnd < Time[iBarsToCalc]) return(0);


      // If max number of iterations reached, exit
      if (iPlots >= DaysToPlot) return(0);

      // If the range to be plotted has data, plot it
      if (iBarShift(NULL,PERIOD_M1,dtBoxStart,false) != iBarShift(NULL,PERIOD_M1,dtBoxEnd,false)) {
         Print(TimeToStr(dtBoxStart), "  ", TimeToStr(dtBoxEnd));
         doCalcValueInRange(dtBoxStart);
         iPlots++;
      }
      else {
         Print("No data for ", TimeToStr(dtBoxStart), "  ", TimeToStr(dtBoxEnd));
      }

      // Decrement dates
      dtBoxStart   -= SECONDS_IN_DAY;
      dtBoxEnd   -= SECONDS_IN_DAY;
   }
}

void doCalcValueInRange(datetime dtBoxStart) {

   // Determine box end time based on box start time
   // Insure it's after box start
   datetime dtBoxEnd   = StrToTime(TimeToStr(dtBoxStart,TIME_DATE) + " " + BoxEnd);
   if (dtBoxEnd < dtBoxStart) dtBoxEnd += SECONDS_IN_DAY;

   // Determine line end time based on box end time
   // Insure it's after box end
   datetime dtLineEnd   = StrToTime(TimeToStr(dtBoxEnd,TIME_DATE) + " " + LineEnd);
   if (dtLineEnd < dtBoxEnd) dtLineEnd += SECONDS_IN_DAY;

   // Figure out start and end bars for box on the minute chart
   // Make sure the timestamp of start bar is >= box start time
   int iStart   = iBarShift(NULL,PERIOD_M1,dtBoxStart,false);
   int iEnd   = iBarShift(NULL,PERIOD_M1,dtBoxEnd,false);
   while (iTime(NULL,PERIOD_M1,iStart) < dtBoxStart) iStart--;

   // Get the high and low prices for the day
   double dHigh = iHigh(NULL,PERIOD_M1,iHighest(NULL,PERIOD_M1,MODE_HIGH,iStart-iEnd,iEnd));
   double dLow  = iLow (NULL,PERIOD_M1,iLowest (NULL,PERIOD_M1,MODE_LOW ,iStart-iEnd,iEnd));

   // Draw the box
   doDrawBox(dtBoxStart,dtBoxEnd,dHigh,dLow);

   // Draw the high/low lines
   doDrawRangeLines(dtBoxStart,dtLineEnd,dHigh,dLow);

   // Draw the price distribution
   doDrawDistribution(dtBoxStart,dtLineEnd,dHigh,dLow);

}

void doDrawBox(datetime dtStart, datetime dtEnd, double dHigh, double dLow) {

   // Draw the box
   string sObjName = OBJNAME_PREPEND + " " + TimeToStr(dtStart);
   ObjectCreate(sObjName,OBJ_RECTANGLE,0,dtStart,dHigh,dtEnd,dLow);
   ObjectSet(sObjName,OBJPROP_COLOR,BoxColor);

}

void doDrawRangeLines(datetime dtStart, datetime dtEnd, double dHigh, double dLow) {

   string sObjName;

   // Draw range high
   sObjName = OBJNAME_PREPEND + " " + TimeToStr(dtStart) + " " + "High";
   ObjectCreate(sObjName,OBJ_TREND,0,dtStart,dHigh,dtEnd,dHigh);
   ObjectSet(sObjName,OBJPROP_RAY,false);
   ObjectSet(sObjName,OBJPROP_COLOR,LineColor);

   // Draw range low
   sObjName = OBJNAME_PREPEND + " " + TimeToStr(dtStart) + " " + "Low";
   ObjectCreate(sObjName,OBJ_TREND,0,dtStart,dLow,dtEnd,dLow);
   ObjectSet(sObjName,OBJPROP_RAY,false);
   ObjectSet(sObjName,OBJPROP_COLOR,LineColor);

}

void doDrawDistribution(datetime dtStart, datetime dtEnd, double dHigh, double dLow) {

   // Buckets to place 'ticks' into.
   double    dBuckets[50];

   ArrayInitialize(dBuckets,0.0);

   // Var to tally total 'ticks'
   int      iTicks   = 0;

   // Figure out the value to use to "split" prices into different buckets
   double    dSplitter = (dHigh - dLow) / ArraySize(dBuckets);

   // Get the offset for the first minute bar of the range.
   double iStartBar = iBarShift(NULL,PERIOD_M1,dtStart,false);
   while (iTime(NULL,PERIOD_M1,iStartBar) < dtStart) iStartBar--;

   // Get the offset for the last minute bar of the range.
   double iEndBar = iBarShift(NULL,PERIOD_M1,dtEnd,false);

   // Iterate all minutes of the day and place a 'tick' in each bucket
   // that price touched
   for (int i=iStartBar;i>=iEndBar;i--) {
      for (int j=0;j<=ArraySize(dBuckets)-1;j++) {
         double dBucketHigh = dHigh - (j)  *dSplitter;
         double dBucketLow  = dHigh - (j+1)*dSplitter;

         // If price was above bucket range, no tick
         if (iLow(NULL,PERIOD_M1,i) > dBucketHigh)
            continue;
         // If price was below bucket range, no tick
         if (iHigh(NULL,PERIOD_M1,i) <= dBucketLow)
            continue;

         // bucket gets a tick
         dBuckets[j] += 1;
         iTicks++;
      }
   }

   //string sObjName = OBJNAME_PREPEND + " " + TimeToStr(dtStart) + " TickTotal";
   //ObjectCreate(sObjName,OBJ_TEXT,0,dtStart,(dHigh+dLow)*0.5);
   //ObjectSetText(sObjName,"Ticks: " + iTicks);

   // Draw Bucket Lines
   for (j=0;j<=ArraySize(dBuckets)-1;j++) {
      dBucketHigh = dHigh - (j)  *dSplitter;
      dBucketLow  = dHigh - (j+1)*dSplitter;

      // Create a name for the bucket object
      string sObjName = OBJNAME_PREPEND + " " + TimeToStr(dtStart) + " Bucket " + j+1;
      // Determine how many bars long it will be.  Each bar indicates bucket contained 5% of the price action
      int   iObjLength = 1;
      if (iTicks > 0)   iObjLength = (dBuckets[j]/iTicks)*PlotMagnification;

      ObjectCreate(sObjName,OBJ_RECTANGLE,0,dtStart,dBucketHigh,dtStart+Period()*60*iObjLength,dBucketLow);
      ObjectSet(sObjName,OBJPROP_COLOR,PlotColor);

   }
}

void DeleteObjects(string sObjNamePrepend) {

   // delete objects
   for (int i=ObjectsTotal()-1;i>=0;i--) {
      string sObjName = ObjectName(i);
      if (StringFind(sObjName,sObjNamePrepend) == 0)
         ObjectDelete(sObjName);
   }
}
Sample
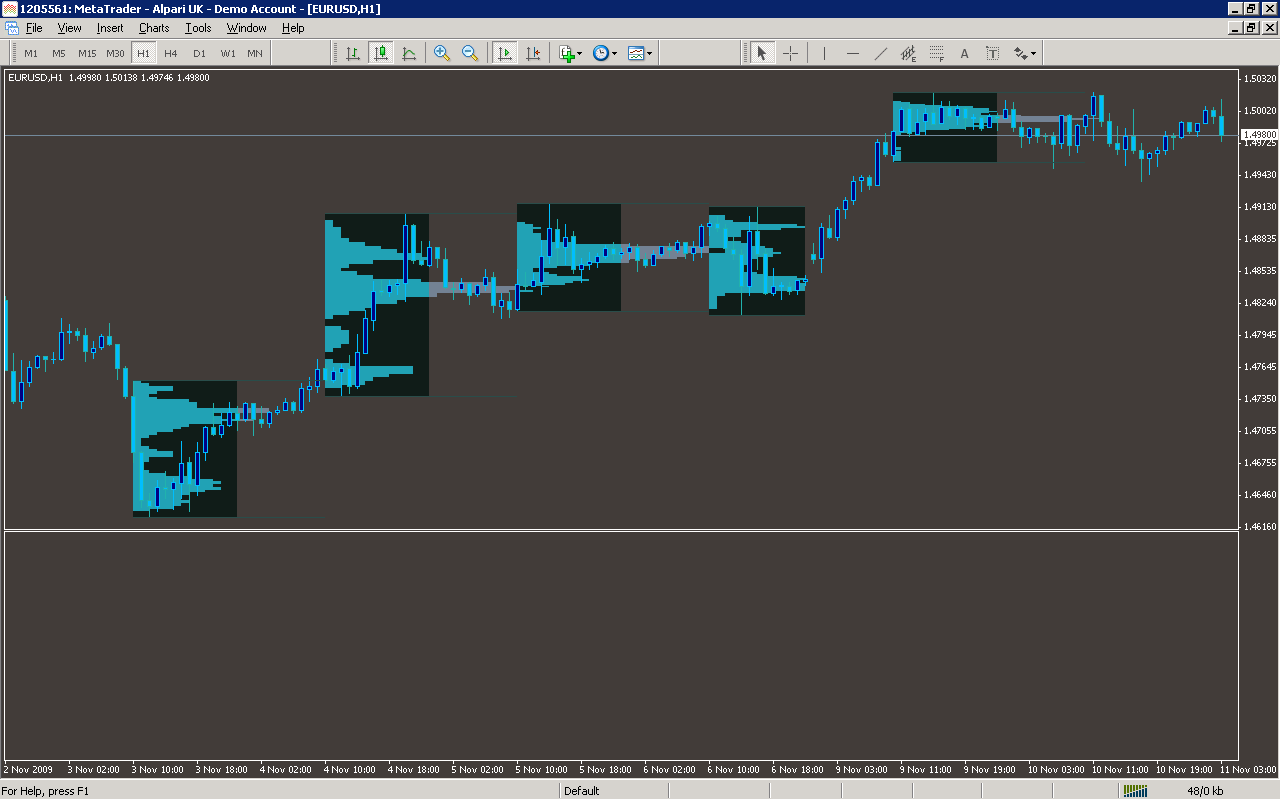
Analysis
Market Information Used:
Series array that contains open time of each bar
Series array that contains the highest prices of each bar
Series array that contains the lowest prices of each bar
Indicator Curves created:
Indicators Used:
Custom Indicators Used:
Order Management characteristics:
Other Features: