//+------------------------------------------------------------------+
//|                                         PriceChannel_Stop_v6.mq4 |
//|                           Copyright © 2005, TrendLaboratory Ltd. |
//|                                       E-mail: igorad2004@list.ru |
//+------------------------------------------------------------------+
#property copyright "Copyright © 2005, TrendLaboratory Ltd."
#property link      "E-mail: igorad2004@list.ru"

#property indicator_chart_window
#property indicator_buffers 8
#property indicator_color1 Blue
#property indicator_color2 Red
#property indicator_color3 Blue
#property indicator_color4 Red
#property indicator_color5 Blue
#property indicator_color6 Red
#property indicator_color7 Blue
#property indicator_color8 Red
//---- input parameters
extern int ChannelPeriod=9;   //Price Channel Period
extern double Risk=0.30;      //channel narrowing factor (0...0,5)
extern int Signal=1;          //Display signals mode: 1-Signals & Stops; 0-only Stops; 2-only Signals;
extern int Line=1;            //Display line mode: 0-no,1-yes
extern int ColorBar=1;        //Display color bars mode: 0-no,1-yes
extern int TimeFrame=0;       //TimeFrame in min
extern int Nbars=1000;
//---- indicator buffers
double UpTrendBuffer[];
double DownTrendBuffer[];
double UpTrendSignal[];
double DownTrendSignal[];
double UpTrendLine[];
double DownTrendLine[];
double UpTrendBar[];
double DownTrendBar[];
//+------------------------------------------------------------------+
//| Custom indicator initialization function                         |
//+------------------------------------------------------------------+
int init()
  {
   string short_name;
//---- indicator line
   SetIndexBuffer(0,UpTrendBuffer);
   SetIndexBuffer(1,DownTrendBuffer);
   SetIndexBuffer(2,UpTrendSignal);
   SetIndexBuffer(3,DownTrendSignal);
   SetIndexBuffer(4,UpTrendLine);
   SetIndexBuffer(5,DownTrendLine);
   SetIndexBuffer(6,UpTrendBar);
   SetIndexBuffer(7,DownTrendBar);
   SetIndexStyle(0,DRAW_ARROW);
   SetIndexStyle(1,DRAW_ARROW);
   SetIndexStyle(2,DRAW_ARROW);
   SetIndexStyle(3,DRAW_ARROW);
   SetIndexStyle(4,DRAW_LINE);
   SetIndexStyle(5,DRAW_LINE);
   SetIndexStyle(6,DRAW_HISTOGRAM,STYLE_SOLID,1);
   SetIndexStyle(7,DRAW_HISTOGRAM,STYLE_SOLID,1);
   SetIndexArrow(0,159);
   SetIndexArrow(1,159);
   SetIndexArrow(2,108);
   SetIndexArrow(3,108);
//---- name for DataWindow and indicator subwindow label
   short_name="PriceChannel_Stop("+ChannelPeriod+")";
   IndicatorShortName(short_name);
   SetIndexLabel(0,"UpTrend Stop");
   SetIndexLabel(1,"DownTrend Stop");
   SetIndexLabel(2,"UpTrend Signal");
   SetIndexLabel(3,"DownTrend Signal");
   SetIndexLabel(4,"UpTrend Line");
   SetIndexLabel(5,"DownTrend Line");
   SetIndexLabel(6,"UpTrend Bar");
   SetIndexLabel(7,"DownTrend Bar");
//----
   SetIndexDrawBegin(0,ChannelPeriod);
   SetIndexDrawBegin(1,ChannelPeriod);
   SetIndexDrawBegin(2,ChannelPeriod);
   SetIndexDrawBegin(3,ChannelPeriod);
   SetIndexDrawBegin(4,ChannelPeriod);
   SetIndexDrawBegin(5,ChannelPeriod);
   SetIndexDrawBegin(6,ChannelPeriod);
   SetIndexDrawBegin(7,ChannelPeriod);
//----
   return(0);
  }
//+------------------------------------------------------------------+
//| PriceChannel_Stop_v6                                             |
//+------------------------------------------------------------------+
int start()
  {
   datetime TimeArray[];
   int    i,shift,trend,y=0;
   double high, low, price, sum, VolAverage,UpBar,DnBar;
   double smax[25000],smin[25000],bsmax[25000],bsmin[25000],Mid[25000],Vol[25000];
   double LowArray[],HighArray[];

   for (shift=Nbars-1;shift>=0;shift--)
   {
   UpTrendBuffer[shift]=0.0;
   DownTrendBuffer[shift]=0.0;
   UpTrendSignal[shift]=0.0;
   DownTrendSignal[shift]=0.0;
   UpTrendLine[shift]=EMPTY_VALUE;
   DownTrendLine[shift]=EMPTY_VALUE;
   UpTrendBar[shift]=0.0;
	DownTrendBar[shift]=0.0;
   }
// Draw price channel boards + calculation : Channel middle, half channel width,


   ArrayCopySeries(TimeArray,MODE_TIME,Symbol(),TimeFrame);
   ArrayCopySeries(LowArray,MODE_LOW,Symbol(),TimeFrame);
   ArrayCopySeries(HighArray,MODE_HIGH,Symbol(),TimeFrame);

   for(i=0,y=0;i<Nbars;i++)
   {
   if (Time[i]<TimeArray[y]) y++;
   smin[i]=LowArray[Lowest(NULL,TimeFrame,MODE_LOW,ChannelPeriod,y)];
   smax[i]=HighArray[Highest(NULL,TimeFrame,MODE_HIGH,ChannelPeriod,y)];
   Mid[i]=0.5*(smin[i]+smax[i]);
   }

//

   for (shift=Nbars-ChannelPeriod-1;shift>=0;shift--)
   {
// Calculation channel stop values

     bsmax[shift]=smax[shift]-(smax[shift]-smin[shift])*Risk;
	  bsmin[shift]=smin[shift]+(smax[shift]-smin[shift])*Risk;

// Signal area : any conditions to trend determination:
// 1. Price Channel breakout

     if(Risk>0)
     {
      if(Close[shift]>bsmax[shift])  trend=1;
      if(Close[shift]<bsmin[shift])  trend=-1;
     }
     else
     {
      if(Close[shift]>bsmax[shift+1])  trend=1;
      if(Close[shift]<bsmin[shift+1])  trend=-1;
     }

// Correction boards values with existing trend

	  if(trend>0 && bsmin[shift]<bsmin[shift+1]) bsmin[shift]=bsmin[shift+1];
	  if(trend<0 && bsmax[shift]>bsmax[shift+1]) bsmax[shift]=bsmax[shift+1];

// Drawing area
	  UpBar=bsmax[shift];
	  DnBar=bsmin[shift];

	  if ( Risk == 0 ){UpBar=Mid[shift];DnBar=Mid[shift];}

	  if (trend>0)
	  {
	     if (Signal>0 && UpTrendBuffer[shift+1]==-1.0)
	     {
	        //bsmin[shift]=smin[shift];
	        UpTrendSignal[shift]=bsmin[shift];
	        if(Line>0) UpTrendLine[shift]=bsmin[shift];

	     }
	     else
	     {
	     UpTrendBuffer[shift]=bsmin[shift];
	     if(Line>0) UpTrendLine[shift]=bsmin[shift];
	     UpTrendSignal[shift]=-1;
	     }
	  if(ColorBar>0)
	        {
	           if(Close[shift]>UpBar)
	           {
	              UpTrendBar[shift]=High[shift];
	              DownTrendBar[shift]=Low[shift];
	           }
	           else
	           {
	              UpTrendBar[shift]=EMPTY_VALUE;
	              DownTrendBar[shift]=EMPTY_VALUE;
	           }

	        }
	  if (Signal==2) UpTrendBuffer[shift]=0;
	  DownTrendBuffer[shift]=-1.0;
	  DownTrendLine[shift]=EMPTY_VALUE;
	  }

	  if (trend<0)
	  {
	  if (Signal>0 && DownTrendBuffer[shift+1]==-1.0)
	     {
	     //bsmax[shift]=smax[shift];
	     DownTrendSignal[shift]=bsmax[shift];
	     if(Line>0) DownTrendLine[shift]=bsmax[shift];
	     }
	     else
	     {
	     DownTrendBuffer[shift]=bsmax[shift];
	     if(Line>0)DownTrendLine[shift]=bsmax[shift];
	     DownTrendSignal[shift]=-1;
	     }
	  if(ColorBar>0)
	        {
	           if(Close[shift]<DnBar)
	           {
	              UpTrendBar[shift]=Low[shift];
	              DownTrendBar[shift]=High[shift];
	           }
	           else
	           {
	              UpTrendBar[shift]=EMPTY_VALUE;
	              DownTrendBar[shift]=EMPTY_VALUE;
	           }
	        }
	  if (Signal==2) DownTrendBuffer[shift]=0;
	  UpTrendBuffer[shift]=-1.0;
	  UpTrendLine[shift]=EMPTY_VALUE;
	  }


   }
   return(0);
  }
//+------------------------------------------------------------------+
Sample
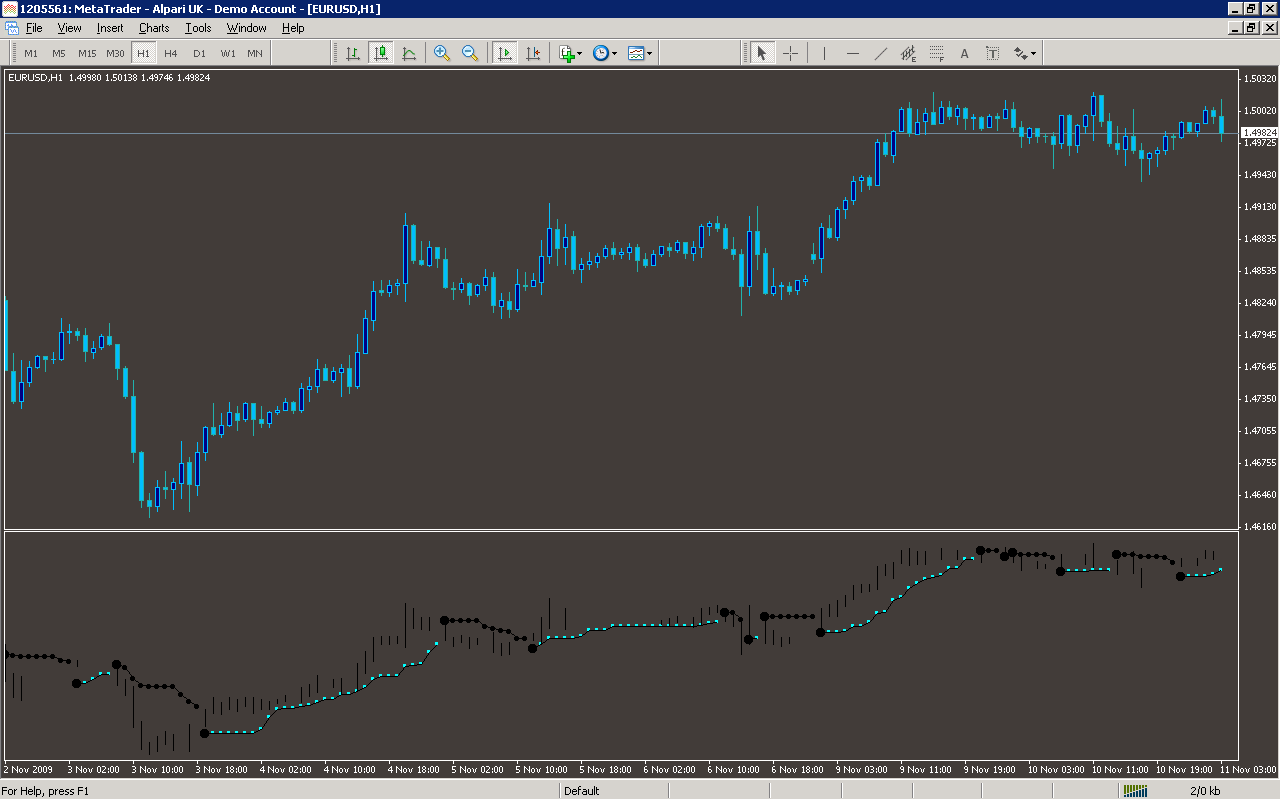
Analysis
Market Information Used:
Series array that contains open time of each bar
Series array that contains close prices for each bar
Series array that contains the highest prices of each bar
Series array that contains the lowest prices of each bar
Indicator Curves created:
Implements a curve of type DRAW_ARROW
Implements a curve of type DRAW_LINE
Implements a curve of type DRAW_HISTOGRAM
Indicators Used:
Custom Indicators Used:
Order Management characteristics:
Other Features: