//+------------------------------------------------------------------+
//| SilverTrend_Signal.mq4
//| Ramdass - Conversion only
//+------------------------------------------------------------------+
#property copyright "SilverTrend  rewritten by CrazyChart"
#property link      "http://viac.ru/"
// mods my Ron Thompson April 2006

#property indicator_chart_window
#property indicator_buffers 2
#property indicator_color1 DodgerBlue
#property indicator_color2 Magenta

//---- input parameters
extern int RISK=3;
extern int CountBars=1500;
extern int SSP=9;
extern bool UseClose=true;

//---- buffers
double val1[];
double val2[];

//+------------------------------------------------------------------+
//| Custom indicator initialization function                         |
//+------------------------------------------------------------------+
int init()
  {
   IndicatorBuffers(2);

   SetIndexStyle(0,DRAW_ARROW);
   SetIndexArrow(0,233);
   SetIndexBuffer(0,val1);

   SetIndexStyle(1,DRAW_ARROW);
   SetIndexArrow(1,234);
   SetIndexBuffer(1,val2);
  }

//+------------------------------------------------------------------+
//| SilverTrend_Signal                                               |
//+------------------------------------------------------------------+
int start()
  {

   int i, i1, shift;

   double Range,AvgRange,smin,smax,SsMax,SsMin;

   bool uptrend,old;

   for (shift=CountBars; shift>=0; shift--)
     {
      Range=0;
      AvgRange=0;

      // Calculate Hi/Lo average for last SSP periods
      for (i1=shift; i1<=shift+SSP; i1++)
        {
         AvgRange=AvgRange+MathAbs(High[i1]-Low[i1]);
        }
      Range=AvgRange/(SSP+1);

      // find highest high and lowest low SSP periods back
      SsMax=High[Highest(Symbol(),0,MODE_HIGH,SSP,shift)];
      SsMin= Low[Lowest (Symbol(),0,MODE_LOW ,SSP,shift)];

      smin = (SsMin+(((SsMax-SsMin)*(33-RISK))/100));
      smax = (SsMax-(((SsMax-SsMin)*(33-RISK))/100));

      if(UseClose)
       {
        if (Close[shift]<smin) uptrend = false;
        if (Close[shift]>smax) uptrend = true;
       }
      else
       {
        if (Open[shift]<smin) uptrend = false;
        if (Open[shift]>smax) uptrend = true;
       }

      if (uptrend!=old && uptrend==true)
        {
         val1[shift]=Low[shift]-Range*1.2;
         val2[shift]=0;
        }

      if (uptrend!=old && uptrend==false)
        {
         val1[shift]=0;
         val2[shift]=High[shift]+Range*1.2;
        }

      old=uptrend;

     }//for

  }//start
Sample
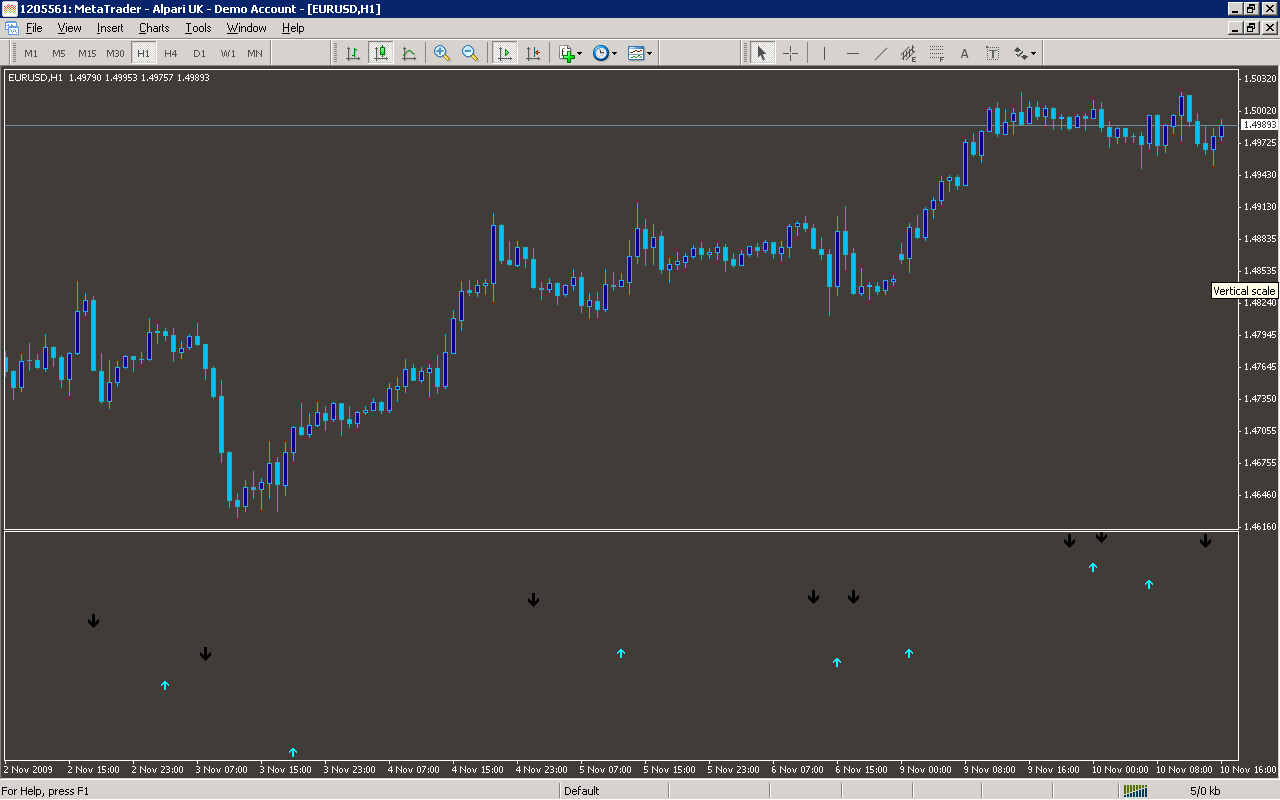
Analysis
Market Information Used:
Series array that contains the highest prices of each bar
Series array that contains the lowest prices of each bar
Series array that contains close prices for each bar
Series array that contains open prices of each bar
Indicator Curves created:
Implements a curve of type DRAW_ARROW
Indicators Used:
Custom Indicators Used:
Order Management characteristics:
Other Features: