//+------------------------------------------------------------------+
//|                                                      Range V1.0  |
//|                                                                  |
//|              Copyright © 2005, Jason Robinson                    |
//|               (jasonrobinsonuk,  jnrtrading)                     |
//|                http://www.jnrtrading.co.uk                       |
//|                                                                  |
//|               THIS VERSION IS FROM MY WEBSITE                    |
//|         (unless it has been posted by me on a forum)             |
//|                                                                  |
//+------------------------------------------------------------------+
#property copyright "Copyright © 2005, Jason Robinson"
#property link      "http://www.jnrtrading.co.uk"

#property indicator_separate_window
#property indicator_buffers 3
#property indicator_color1 Green
#property indicator_color2 FireBrick
#property indicator_color3 Black
#property indicator_minimum 0

double higher[];
double lower[];
double noChange[];

//+------------------------------------------------------------------+
//| Custom indicator initialization function                         |
//+------------------------------------------------------------------+
int init() {
//---- indicators
   SetIndexStyle(0,DRAW_HISTOGRAM);
   SetIndexBuffer(0, higher);
   SetIndexLabel(0, "Higher");
   SetIndexStyle(1,DRAW_HISTOGRAM);
   SetIndexBuffer(1, lower);
   SetIndexLabel(1, "Lower");
   SetIndexStyle(2,DRAW_HISTOGRAM);
   SetIndexBuffer(2, noChange);
   SetIndexLabel(2, "No Change");

   IndicatorShortName("Range (H L nC)");

//----

   return(0);
}
//+------------------------------------------------------------------+
//| Custor indicator deinitialization function                       |
//+------------------------------------------------------------------+
int deinit() {
//----

//----
   return(0);
  }
//+------------------------------------------------------------------+
//| Custom indicator iteration function                              |
//+------------------------------------------------------------------+
int start()
  {
   int limit, i;
   int counted_bars=IndicatorCounted();
//---- check for possible errors
   if(counted_bars<0) return(-1);
//---- last counted bar will be recounted
   if(counted_bars>0) counted_bars--;

   limit=Bars-counted_bars;

   for(i = 0; i <= limit; i++) {
      if (High[i] - Low[i] > High[i+1] - Low[i+1]) {
         higher[i] = High[i] - Low[i];
         lower[i] = 0;
         noChange[i] = 0;
      }
      else if (High[i] - Low[i] < High[i+1] - Low[i+1]) {
         lower[i] = High[i] - Low[i];
         higher[i] = 0;
         noChange[i] = 0;
      }
      else {
         noChange[i] = High[i] - Low[i];
         lower[i] = 0;
         higher[i] = 0;
      }
      ObjectDelete("Range");
      ObjectCreate("Range", OBJ_TEXT, 1, Time[0], High[0] - Low[0]);
      ObjectSetText("Range", "             " + DoubleToStr(High[0] - Low[0], 4), 10, "Verdana", Black);
   }


   return(0);
}
Sample
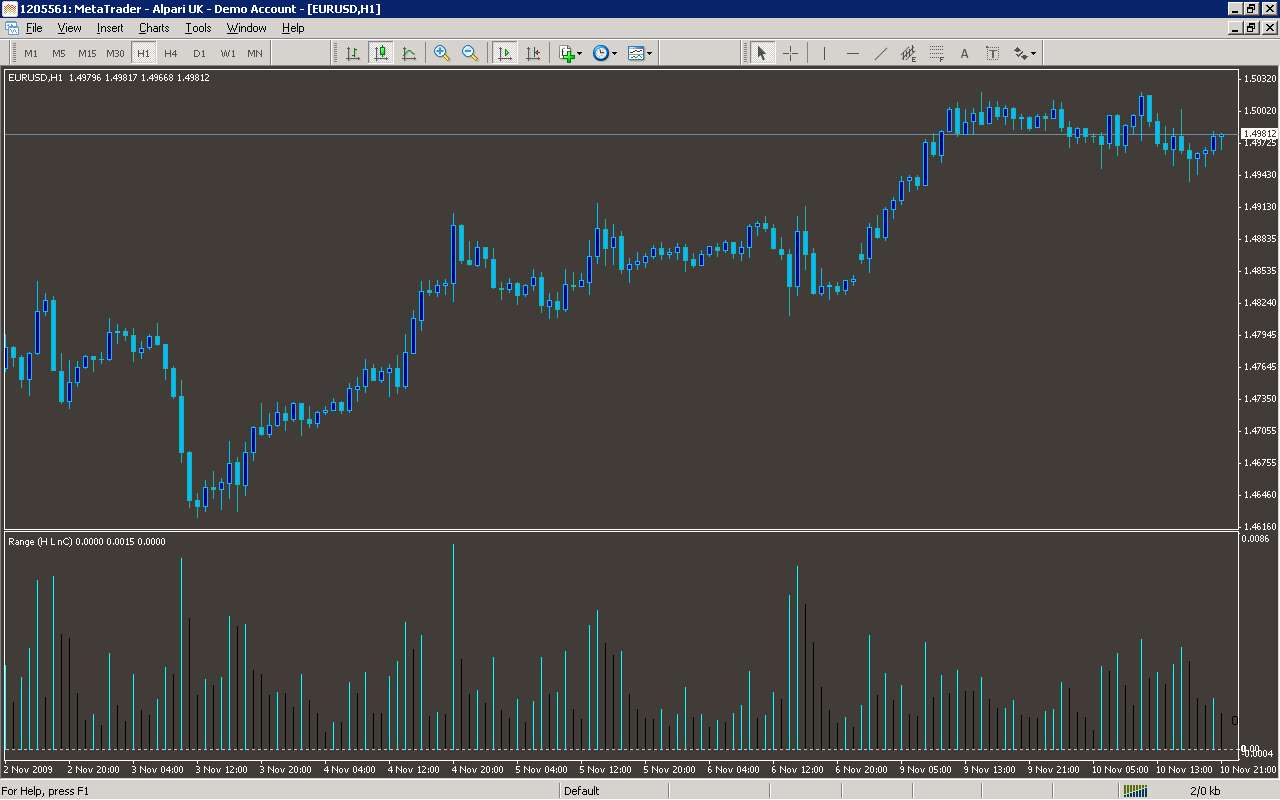
Analysis
Market Information Used:
Series array that contains the highest prices of each bar
Series array that contains the lowest prices of each bar
Series array that contains open time of each bar
Indicator Curves created:
Implements a curve of type DRAW_HISTOGRAM
Indicators Used:
Custom Indicators Used:
Order Management characteristics:
Other Features: