//+------------------------------------------------------------------+
//|                                                  TP RapidRSI.mq4 |
//|                                                 NoName Copyright |
//|                                   http://TakeProfit.BlogSpot.com |
//| Given that the RSI line very rarely moves to oversold or         |
//| overbought we possibly need a more sensitive version of RSI.     |
//| This could be done by selecting an RSI of shorter duration but   |
//| more often than not all this does is increase the volatility of  |
//| the swings without actually providing any signals.               |
//| The alternative is to remove the averaging effect of the up and  |
//| down moves.                                                      |
//| Thus we shall replace this with the sum of the up and down moves:|
//|                                                                  |
//| Rapid RSI = 100 - ( 100 )                                        |
//| (1 - RS)                                                         |
//| Where RS = sum of x day's up closes divided by sum of x day's    |
//| down closes                                                      |
//|                                                                  |
//+------------------------------------------------------------------+
#property copyright "Tak3Profit Copyright"
#property link      "http://TakeProfit.BlogSpot.com"

#property indicator_separate_window
#property indicator_minimum 0
#property indicator_maximum 100
#property indicator_buffers 1
#property indicator_color1 DodgerBlue
#property indicator_level1 70
#property indicator_level2 50
#property indicator_level3 30

extern int RSIPeriod = 14;

double RSI[];
//+------------------------------------------------------------------+
//| Custom indicator initialization function                         |
//+------------------------------------------------------------------+
int init()
{
   IndicatorBuffers(1);
   SetIndexStyle(0, DRAW_LINE);
   SetIndexBuffer(0, RSI);
   SetIndexDrawBegin(0, RSIPeriod);

   string shortName = "RapidRSI [" + RSIPeriod + "]";
   IndicatorShortName(shortName);
   SetIndexLabel(0, shortName);
   SetLevelStyle(STYLE_SOLID,1,Red);

   return(0);
}
//+------------------------------------------------------------------+
//| Custom indicator deinitialization function                       |
//+------------------------------------------------------------------+
int deinit()
{
   return(0);
}
//+------------------------------------------------------------------+
//| Custom indicator iteration function                              |
//+------------------------------------------------------------------+
int start()
{
   int counted_bars=IndicatorCounted();
//----
   if(Bars<=RSIPeriod) return(0);

   int limit = Bars - counted_bars-1;
   for(int i = limit + RSIPeriod; i>=0; i--)
{
      double up=0, down=0, diff=0;
      for(int j= i + RSIPeriod - 1; j>=i; j--){
         diff = Close[j] - Close[j+1];
         if(diff>0)
            up += diff;
         else
            down += -diff;
      }
      if(up + down == 0){
         RSI[i] = 50;
      }else{
         RSI[i] = 100 * up / (up + down);
      }
   }
   return(0);
}
//+------------------------------------------------------------------+
Sample
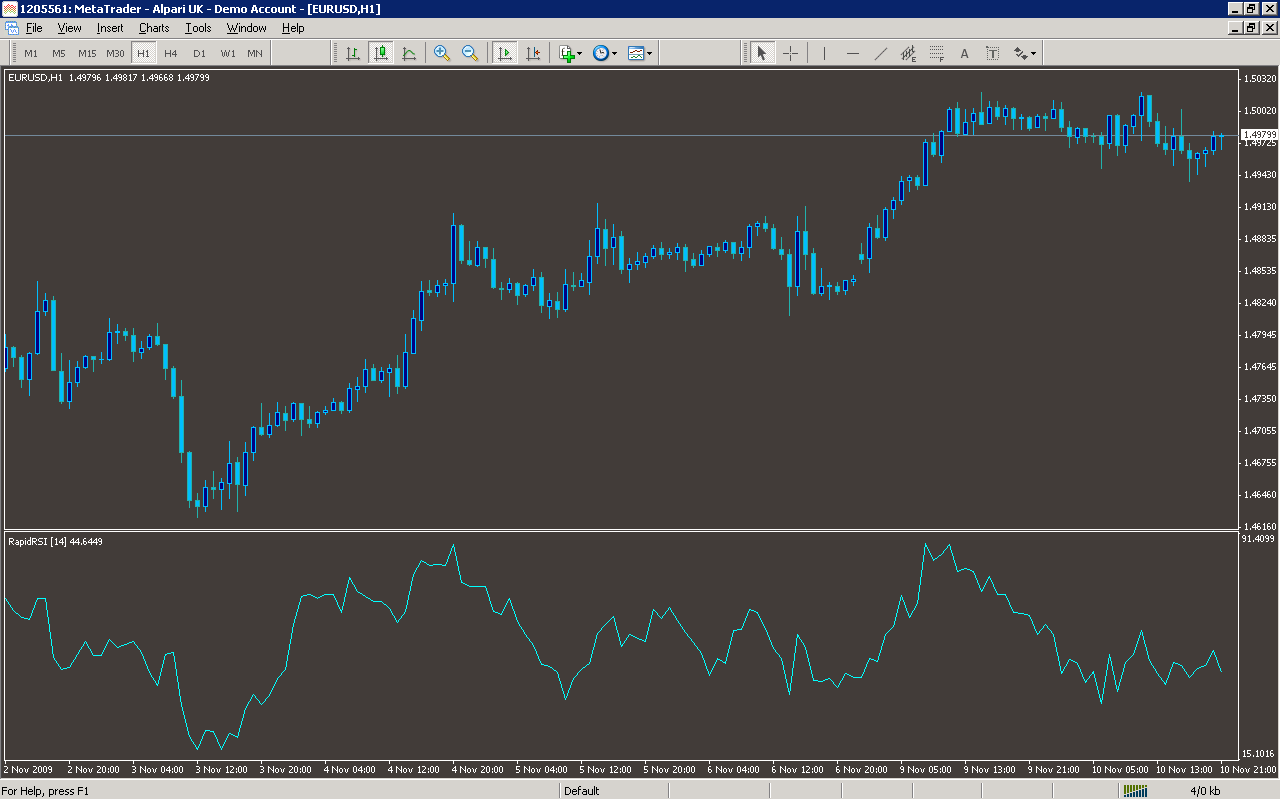
Analysis
Market Information Used:
Series array that contains close prices for each bar
Indicator Curves created:
Implements a curve of type DRAW_LINE
Indicators Used:
Custom Indicators Used:
Order Management characteristics:
Other Features: