//+------------------------------------------------------------------+
//|                                                 forecast osc.mq4 |
//|                Copyright © 2005, Nick Bilak, beluck[AT]gmail.com |
//|                                    http://metatrader.50webs.com/ |
//+------------------------------------------------------------------+
#property copyright "Copyright © 2005, Nick Bilak"
#property link      "http://metatrader.50webs.com/"

#property indicator_separate_window

#property indicator_buffers 2
#property indicator_level1 0

#property indicator_color1 SteelBlue
#property indicator_color2 Red


//---- input parameters
extern int       Regress= 15;
extern int       T3= 3;
extern double    B= 0.7;

//---- buffers
double Osc[];
double Osct3[];

double HiSig[];
double LoSig[];


//+------------------------------------------------------------------+
//| Custom indicator initialization function                         |
//+------------------------------------------------------------------+
int init()
{
   SetIndexStyle(0,DRAW_LINE);
   SetIndexBuffer(0,Osc);

   SetIndexEmptyValue(0,0);
   SetIndexStyle(1,DRAW_LINE);
   SetIndexBuffer(1,Osct3);

   return(0);
}

//+------------------------------------------------------------------+
//| Custor indicator deinitialization function                       |
//+------------------------------------------------------------------+
int deinit()
{
   return(0);
}

//+------------------------------------------------------------------+
//| Custom indicator iteration function                              |
//+------------------------------------------------------------------+
int start()
{
   int counted_bars= IndicatorCounted(),
       limit;

   if (counted_bars<0) return(-1);
   if (counted_bars>0) counted_bars--;

   limit= Bars - counted_bars;

   ForecastOsc(0, limit, Osc, Osct3, Regress, T3, B);

   return (0);
}


//+------------------------------------------------------------------+
//| Calc forecast buffers  from lastbar down to offset               |
//+------------------------------------------------------------------+
void ForecastOsc(int offset, int lastbar, double &osc[], double &osct3[], int regress, int t3, double b)
{
   int shift, length, warmup= 30;
   double b2=b*b,
            b3=b2*b,
            c1=-b3,
            c2=(3*(b2+b3)),
            c3=-3*(2*b2+b+b3),
            c4=(1+3*b+b3+3*b2),
            n = 1 + 0.5*(t3-1),
            w1 = 2 / (n + 1),
            w2 = 1 - w1,
            wt,forecastosc,t3_fosc,sum,
            e1,e2,e3,e4,e5,e6,tmp,tmp2;

   lastbar= MathMin(Bars-warmup-regress, lastbar);

   for (shift= lastbar+warmup; shift>=offset; shift--)   {

      length= regress;
      sum = 0;
      for (int i = length; i>0; i--) {
         tmp = length+1;
         tmp = tmp/3;
         tmp2 = i;
         tmp = tmp2 - tmp;
         sum = sum + tmp*Close[shift+length-i];
      }
      tmp = length;

      wt = sum*6/(tmp*(tmp+1));

      forecastosc= (Close[shift]-wt)/wt*100;

      e1 = w1*forecastosc + w2*e1;
      e2 = w1*e1 + w2*e2;
      e3 = w1*e2 + w2*e3;
      e4 = w1*e3 + w2*e4;
      e5 = w1*e4 + w2*e5;
      e6 = w1*e5 + w2*e6;

      t3_fosc = c1*e6 + c2*e5 + c3*e4 + c4*e3;

      if (shift<=lastbar) {   // don't put swing in cycle into the signal buffers
         osc[shift] = forecastosc;
         osct3[shift] = t3_fosc;
      }

    }

   return(0);
}
Sample
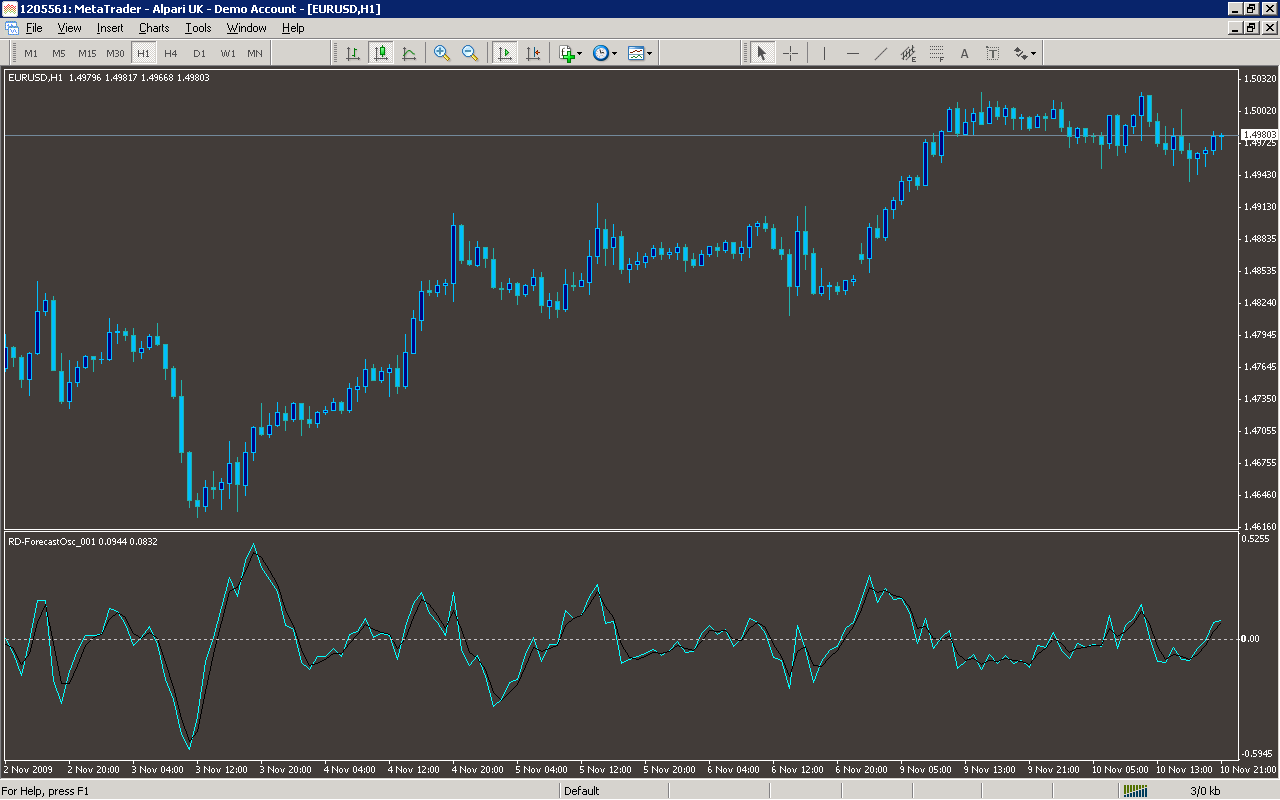
Analysis
Market Information Used:
Series array that contains close prices for each bar
Indicator Curves created:
Implements a curve of type DRAW_LINE
Indicators Used:
Custom Indicators Used:
Order Management characteristics:
Other Features: