//+------------------------------------------------------------------+
//| Pivot.mq4 |
//| Copyright © 2004, MetaQuotes Software Corp. |
//| http://www.metaquotes.net |
//+------------------------------------------------------------------+
#property copyright "Copyright © 2004, MetaQuotes Software Corp."
#property link "http://www.metaquotes.net"
#property indicator_chart_window
extern bool pivots = true;
extern bool camarilla = False;
extern bool midpivots = true;
double day_high=0;
double day_low=0;
double yesterday_high=0;
double yesterday_open=0;
double yesterday_low=0;
double yesterday_close=0;
double today_open=0;
double today_high=0;
double today_low=0;
double P=0;
double Q=0;
double R1,R2,R3;
double M0,M1,M2,M3,M4,M5;
double S1,S2,S3;
double H4,H3,L4,L3;
double nQ=0;
double nD=0;
double D=0;
double rates_d1[2][6];
//+------------------------------------------------------------------+
//| Custom indicator initialization function |
//+------------------------------------------------------------------+
int init()
{
//---- indicators
R1=0; R2=0; R3=0;
M0=0; M1=0; M2=0; M3=0; M4=0; M5=0;
S1=0; S2=0; S3=0;
H4=0; H3=0; L4=0; L3=0;
//----
return(0);
}
//+------------------------------------------------------------------+
//| Custor indicator deinitialization function |
//+------------------------------------------------------------------+
int deinit()
{
ObjectDelete("R1 Label");
ObjectDelete("R1 Line");
ObjectDelete("R2 Label");
ObjectDelete("R2 Line");
ObjectDelete("R3 Label");
ObjectDelete("R3 Line");
ObjectDelete("S1 Label");
ObjectDelete("S1 Line");
ObjectDelete("S2 Label");
ObjectDelete("S2 Line");
ObjectDelete("S3 Label");
ObjectDelete("S3 Line");
ObjectDelete("P Label");
ObjectDelete("P Line");
ObjectDelete("H4 Label");
ObjectDelete("H4 Line");
ObjectDelete("H3 Label");
ObjectDelete("H3 Line");
ObjectDelete("L3 Label");
ObjectDelete("L3 Line");
ObjectDelete("L4 Label");
ObjectDelete("L4 Line");
ObjectDelete("M5 Label");
ObjectDelete("M5 Line");
ObjectDelete("M4 Label");
ObjectDelete("M4 Line");
ObjectDelete("M3 Label");
ObjectDelete("M3 Line");
ObjectDelete("M2 Label");
ObjectDelete("M2 Line");
ObjectDelete("M1 Label");
ObjectDelete("M1 Line");
ObjectDelete("M0 Label");
ObjectDelete("M0 Line");
return(0);
}
//+------------------------------------------------------------------+
//| Custom indicator iteration function |
//+------------------------------------------------------------------+
int start()
{
//---- exit if period is greater than daily charts
if(Period() > 1440)
{
Print("Error - Chart period is greater than 1 day.");
return(-1); // then exit
}
//---- Get new daily prices
ArrayCopyRates(rates_d1, Symbol(), PERIOD_D1);
yesterday_close = rates_d1[1][4];
yesterday_open = rates_d1[1][1];
today_open = rates_d1[0][1];
yesterday_high = rates_d1[1][3];
yesterday_low = rates_d1[1][2];
day_high = rates_d1[0][3];
day_low = rates_d1[0][2];
//---- Calculate Pivots
D = (day_high - day_low);
Q = (yesterday_high - yesterday_low);
P = (yesterday_high + yesterday_low + yesterday_close) / 3;
R1 = (2*P)-yesterday_low;
S1 = (2*P)-yesterday_high;
R2 = P+(yesterday_high - yesterday_low);
S2 = P-(yesterday_high - yesterday_low);
H4 = (Q*0.55)+yesterday_close;
H3 = (Q*0.27)+yesterday_close;
R3 = (2*P)+(yesterday_high-(2*yesterday_low));
M5 = (R2+R3)/2;
// R2 = P-S1+R1;
M4 = (R1+R2)/2;
// R1 = (2*P)-yesterday_low;
M3 = (P+R1)/2;
// P = (yesterday_high + yesterday_low + yesterday_close)/3;
M2 = (P+S1)/2;
// S1 = (2*P)-yesterday_high;
M1 = (S1+S2)/2;
// S2 = P-R1+S1;
S3 = (2*P)-((2* yesterday_high)-yesterday_low);
L3 = yesterday_close-(Q*0.27);
L4 = yesterday_close-(Q*0.55);
M0 = (S2+S3)/2;
if (Q > 5) { nQ = Q; }
else { nQ = Q*10000; }
if (D > 5) { nD = D; }
else { nD = D*10000; }
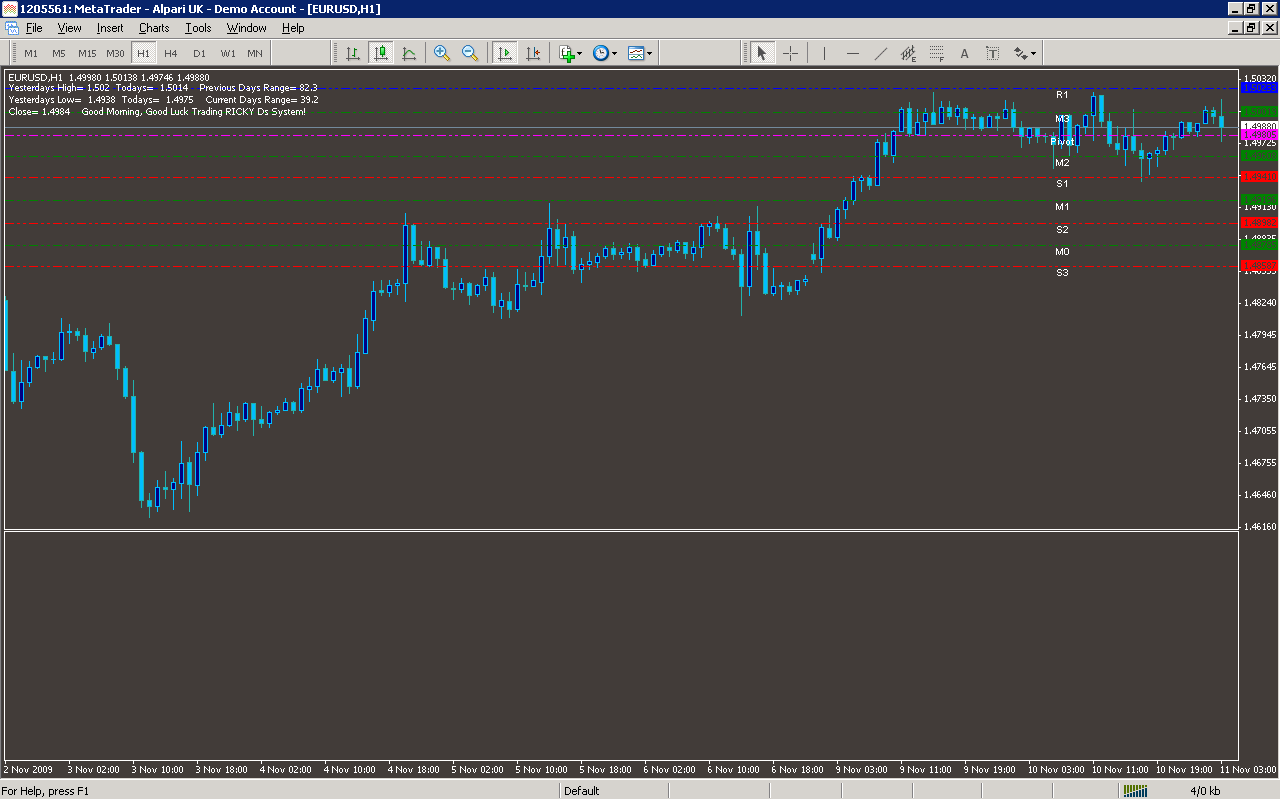
Comment("Yesterdays High= ",yesterday_high, " Todays= ",day_high, " Previous Days Range= ",nQ,"\n",
"Yesterdays Low= ",yesterday_low, " Todays= ",day_low, " Current Days Range= ",nD,"\n",
"Close= ",yesterday_close, " Good Morning, Good Luck Trading RICKY Ds System!");
//---- Set line labels on chart window
//---- Pivot Lines
if (pivots==true) {
SetLevel("R1", R1, Blue);
SetLevel("R2", R2, Blue);
SetLevel("R3", R3, Blue);
SetLevel("Pivot", P, Magenta);
SetLevel("S1", S1, Red);
SetLevel("S2", S2, Red);
SetLevel("S3", S3, Red);
}
//----- Camarilla Lines
if (camarilla==true) {
SetLevel("H3", H3, Yellow);
SetLevel("H4", H4, Yellow);
SetLevel("L3", L3, Yellow);
SetLevel("L4", L4, Yellow);
}
//------ Midpoints Pivots
if (midpivots==true) {
SetLevel("M5", M5, Green);
SetLevel("M4", M4, Green);
SetLevel("M3", M3, Green);
SetLevel("M2", M2, Green);
SetLevel("M1", M1, Green);
SetLevel("M0", M0, Green);
}
return(0);
}
//+------------------------------------------------------------------+
//| Helper |
//+------------------------------------------------------------------+
void SetLevel(string text, double level, color col1)
{
string labelname= text + " Label";
string linename= text + " Line";
if (ObjectFind(labelname) != 0) {
ObjectCreate(labelname, OBJ_TEXT, 0, Time[20], level);
ObjectSetText(labelname, " " + text, 8, "Arial", White);
}
else {
ObjectMove(labelname, 0, Time[20], level);
}
if (ObjectFind(linename) != 0) {
ObjectCreate(linename, OBJ_HLINE, 0, Time[40], level);
ObjectSet(linename, OBJPROP_STYLE, STYLE_DASHDOTDOT);
ObjectSet(linename, OBJPROP_COLOR, col1);
}
else {
ObjectMove(linename, 0, Time[40], level);
}
}
Sample
Analysis
Market Information Used:
Series array that contains open time of each bar
Indicator Curves created:
Indicators Used:
Custom Indicators Used:
Order Management characteristics:
Other Features: