//+------------------------------------------------------------------+
//|                                                  RSI Candles.mq4 |
//|                                                                  |
//+------------------------------------------------------------------+
#property copyright "Copyright © 2007, Christof Risch (iya)"
#property link      "http://www.forexfactory.com/showthread.php?t=13321"
#property indicator_chart_window
#property indicator_buffers 4
#property indicator_color1 Green//wick
#property indicator_color2 Red//wick
#property indicator_color3 Green//candle
#property indicator_color4 Red//candle
#property indicator_width1 1
#property indicator_width2 1
#property indicator_width3 3
#property indicator_width4 3


//---- stoch settings
extern int	RSI_Period		= 5;
extern int  RSI_Price      = 0;
extern int	Overbought		= 80;
extern int	Oversold			= 20;

//---- input parameters
extern int	BarWidth			= 1,
				CandleWidth		= 3;

//---- buffers
double Bar1[],
		 Bar2[],
		 Candle1[],
		 Candle2[];


//+------------------------------------------------------------------+
//| Custom indicator initialization function                         |
//+------------------------------------------------------------------+
int init()
{
//---- indicators
	IndicatorShortName("RSI Candles:("+	RSI_Period+")");
	IndicatorBuffers(4);
	SetIndexBuffer(0,Bar1);
	SetIndexBuffer(1,Bar2);
	SetIndexBuffer(2,Candle1);
	SetIndexBuffer(3,Candle2);
	SetIndexStyle(0,DRAW_HISTOGRAM,0,BarWidth);
	SetIndexStyle(1,DRAW_HISTOGRAM,0,BarWidth);
	SetIndexStyle(2,DRAW_HISTOGRAM,0,CandleWidth);
	SetIndexStyle(3,DRAW_HISTOGRAM,0,CandleWidth);

	return(0);
}

//+------------------------------------------------------------------+
double RSI  	(int i = 0)	{return(iRSI(NULL,0,RSI_Period,RSI_Price,i));}


//+------------------------------------------------------------------+
void SetCandleColor(int col, int i)
{
	double high,low,bodyHigh,bodyLow;


	{
		bodyHigh = MathMax(Open[i],Close[i]);
		bodyLow  = MathMin(Open[i],Close[i]);
		high		= High[i];
		low		= Low[i];
	}

	Bar1[i] = low;	Candle1[i] = bodyLow;
	Bar2[i] = low;	Candle2[i] = bodyLow;


	switch(col)
	{
		case 1: 	Bar1[i] = high;	Candle1[i] = bodyHigh;	break;
		case 2: 	Bar2[i] = high;	Candle2[i] = bodyHigh;	break;

	}
}

//+------------------------------------------------------------------+
//| Custom indicator iteration function                              |
//+------------------------------------------------------------------+
int start()
{
	for(int i = MathMax(Bars-1-IndicatorCounted(),1); i>=0; i--)
	{
		double	rsi	= RSI(i);


				if(rsi > Overbought)		SetCandleColor(1,i);
		else	if(rsi < Oversold)		SetCandleColor(2,i);

	}


	return(0);
}
//+------------------------------------------------------------------+
Sample
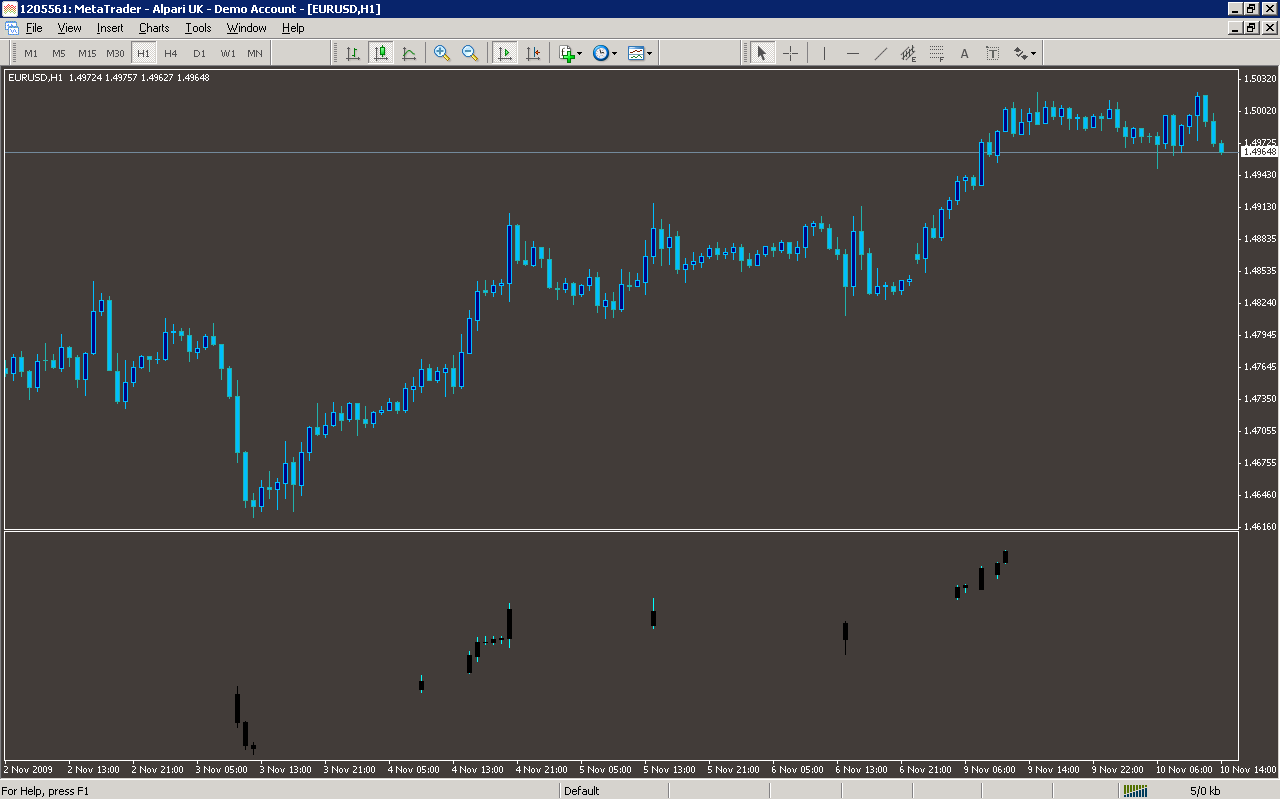
Analysis
Market Information Used:
Series array that contains close prices for each bar
Series array that contains open prices of each bar
Series array that contains the highest prices of each bar
Series array that contains the lowest prices of each bar
Indicator Curves created:
Implements a curve of type DRAW_HISTOGRAM
Indicators Used:
Relative strength index
Custom Indicators Used:
Order Management characteristics:
Other Features: