//+------------------------------------------------------------------+
//|RSI_Filter_mtf                                 Filter overRSI.mq4 |
//|                   Copyright © 2006, Indoforex Groups - Primajaya |
//| MTF:ForexTSD.com            ki    http://primaforex.blogspot.com |
//+------------------------------------------------------------------+
#property copyright "Copyright © 2006, Indoforex Groups"
#property link      "http://primaforex.blogspot.com"

#property indicator_separate_window
#property indicator_minimum 0
#property indicator_maximum 1
#property indicator_buffers 4

#property indicator_color1 Blue
#property indicator_color2 Red
#property indicator_color3 SteelBlue
#property indicator_color4 Orange

#property indicator_width1  2
#property indicator_width2  2
#property indicator_width3  2
#property indicator_width4  2

//---- input parameters
extern int TimeFrame=0;

extern int    PeriodeRSI  = 14;
extern double UpTrendLevel        = 61.80;
extern double DownTrendLevel      = 38.20;
extern int    MaxBarsToCount      = 1500;

extern string _MainTrend          = "50";
extern string _TimeFrames = "M1;5,15,30,60H1;240H4;1440D1;10080W1;43200MN|0-CurrentTF";

//---- indicator buffers

double UpBuffer1[];
double DnBuffer1[];
double UpBuffer2[];
double DnBuffer2[];

//+------------------------------------------------------------------+
//| Custom indicator initialization function                         |
//+------------------------------------------------------------------+
  int init()
  {
   string short_name;
//---- indicator line
   SetIndexStyle(0,DRAW_HISTOGRAM);
   SetIndexStyle(1,DRAW_HISTOGRAM);
   SetIndexStyle(2,DRAW_HISTOGRAM);
   SetIndexStyle(3,DRAW_HISTOGRAM);

   SetIndexBuffer(0,UpBuffer1);
   SetIndexBuffer(1,DnBuffer1);
   SetIndexBuffer(2,UpBuffer2);
   SetIndexBuffer(3,DnBuffer2);


//----
   SetIndexDrawBegin(0,PeriodeRSI);
   SetIndexDrawBegin(1,PeriodeRSI);
   SetIndexDrawBegin(2,PeriodeRSI);
   SetIndexDrawBegin(3,PeriodeRSI);


  //---- name for DataWindow and indicator subwindow label
   switch(TimeFrame)
   {
      case 1       : string TimeFrameStr="Period_M1";  break;
      case 5       : TimeFrameStr="Period_M5";         break;
      case 15      : TimeFrameStr="Period_M15";        break;
      case 30      : TimeFrameStr="Period_M30";        break;
      case 60      : TimeFrameStr="Period_H1";         break;
      case 240     : TimeFrameStr="Period_H4";         break;
      case 1440    : TimeFrameStr="Period_D1";         break;
      case 10080   : TimeFrameStr="Period_W1";         break;
      case 43200   : TimeFrameStr="Period_MN1";        break;
      default      : TimeFrameStr="Current Timeframe";
  }
//---- name for DataWindow and indicator subwindow label
   short_name="RSI_Filter("+PeriodeRSI+") "+TimeFrameStr;
   IndicatorShortName(short_name);
   if (TimeFrame < Period()) TimeFrame = Period();


   SetIndexLabel(0,"RSI>UpTrendL:Overbought or Strong Bulls");
   SetIndexLabel(1,"RSI<DnTrendL:Oversold or Strong Bears");
   SetIndexLabel(2,"50<RSI<UpTrendL:Trend Bulls");
   SetIndexLabel(3,"50>RSI>DnTrendL:Trend Bears");

   IndicatorDigits(MarketInfo(Symbol(),MODE_DIGITS));


   return(0);
  }

//+------------------------------------------------------------------+
//| ProSol Confirmation                                              |
//+------------------------------------------------------------------+
int start()
  {
   int trend;
 double RSI0;

   datetime TimeArray[];
   int    shift,limit,y=0,counted_bars=IndicatorCounted();

// Plot defined time frame on to current time frame
   ArrayCopySeries(TimeArray,MODE_TIME,Symbol(),TimeFrame);

limit=Bars-counted_bars;
limit=MathMax(limit,TimeFrame/Period());
limit=MathMin(limit,MaxBarsToCount);

   for(shift=0,y=0;shift<limit;shift++)
   {
   if (Time[shift]<TimeArray[y]) y++;


   RSI0=iRSI(NULL,TimeFrame,PeriodeRSI,PRICE_CLOSE,y);


	  if (RSI0>  50 && RSI0<UpTrendLevel)    trend= 1;
	  if (RSI0>= UpTrendLevel)               trend= 2;
	  if (RSI0<= 50 && RSI0>DownTrendLevel)  trend=-1;
	  if (RSI0<= DownTrendLevel)             trend=-2;


	  if (trend==1)
	  {

	  UpBuffer1[shift]=0;
	  UpBuffer2[shift]=1;
	  DnBuffer1[shift]=0;
	  DnBuffer2[shift]=0;

	  }
	  if (trend==2)
	  {

	  UpBuffer1[shift]=1;
	  UpBuffer2[shift]=0;
	  DnBuffer1[shift]=0;
	  DnBuffer2[shift]=0;

	  }
	  if (trend==-1)
	  {

	  UpBuffer1[shift]=0;
	  UpBuffer2[shift]=0;
	  DnBuffer1[shift]=0;
	  DnBuffer2[shift]=1;
	  }

	  if (trend==-2)
	  {

	  UpBuffer1[shift]=0;
	  UpBuffer2[shift]=0;
	  DnBuffer1[shift]=1;
	  DnBuffer2[shift]=0;

	  }
	}
	return(0);
 }
Sample
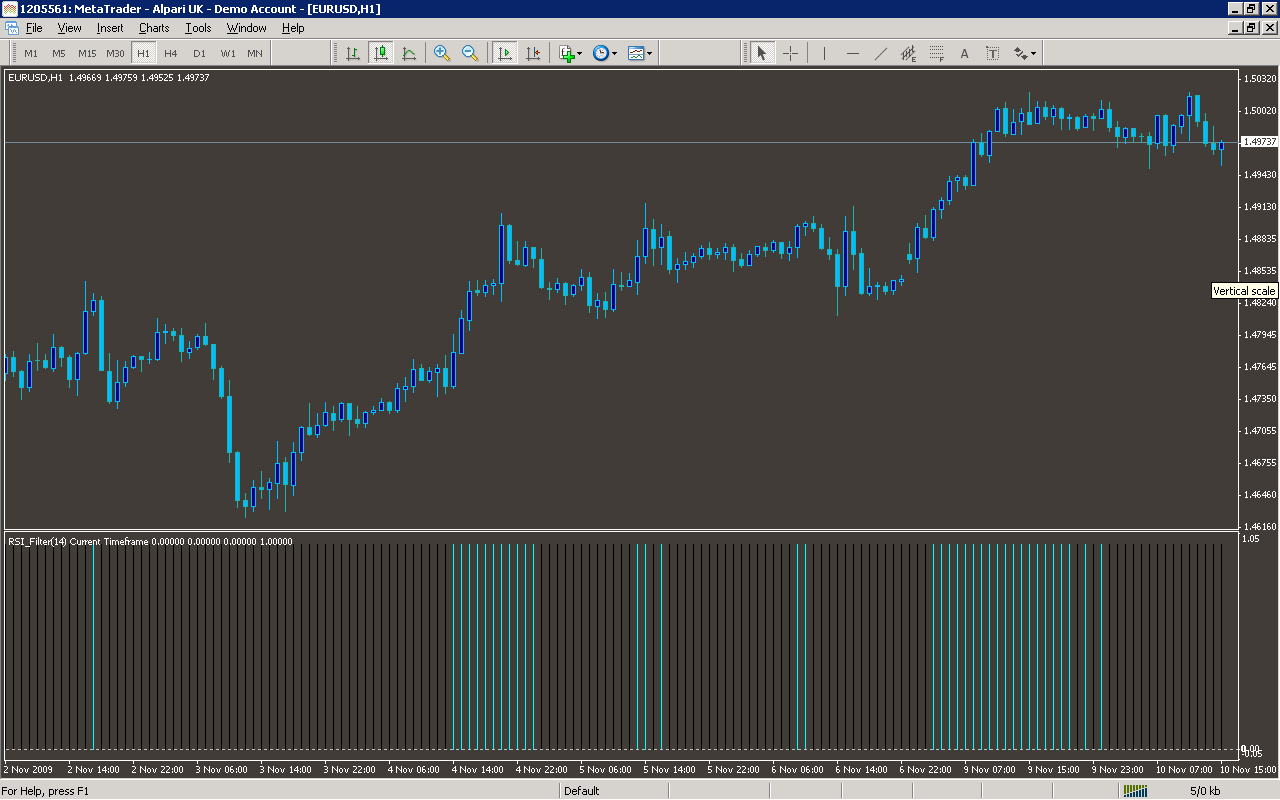
Analysis
Market Information Used:
Series array that contains open time of each bar
Indicator Curves created:
Implements a curve of type DRAW_HISTOGRAM
Indicators Used:
Relative strength index
Custom Indicators Used:
Order Management characteristics:
Other Features: