//+------------------------------------------------------------------+
//| ADX Crossing.mq4
//| Amir
//+------------------------------------------------------------------+
#property  copyright "Author - Amir"

#property indicator_chart_window
#property indicator_buffers 2
#property indicator_color1 LightBlue
#property indicator_color2 Red

//---- input parameters
extern int Timeframe_in_Minutes=15;
extern int RSIperiod=14;
extern int CountBars=350;

//---- buffers
double val1[];
double val2[];
double rsib4,rsinow;

//+------------------------------------------------------------------+
//| Custom indicator initialization function                         |
//+------------------------------------------------------------------+
int init()
  {
   string short_name;
//---- indicator line
   IndicatorBuffers(2);
   SetIndexStyle(0,DRAW_ARROW);
   SetIndexArrow(0,108);
   SetIndexStyle(1,DRAW_ARROW);
   SetIndexArrow(1,108);
   SetIndexBuffer(0,val1);
   SetIndexBuffer(1,val2);
//----
   return(0);
  }
//+------------------------------------------------------------------+
//| AltrTrend_Signal_v2_2                                            |
//+------------------------------------------------------------------+
int start()
  {
  // if (CountBars>=500) CountBars=500;
  // SetIndexDrawBegin(0,500-CountBars);
  // SetIndexDrawBegin(1,500-CountBars);
  int i,shift,counted_bars=IndicatorCounted();


   //---- check for possible errors
  // if(counted_bars<0) return(-1);

   //---- initial zero
  // if(counted_bars<1)
   //  {
    //  for(i=1;i<=CountBars;i++) val1[CountBars-i]=0.0;
    //  for(i=1;i<=CountBars;i++) val2[CountBars-i]=0.0;
    // }

for ( shift = 250; shift>=0; shift--)
{

	rsib4=iCustom(NULL,0,"#MTF_RSI",Timeframe_in_Minutes,14,0,shift+1) ;
	rsinow=iCustom(NULL,0,"#MTF_RSI",Timeframe_in_Minutes,14,0,shift);
Comment (rsib4," ",rsinow);
	val1[shift]=0;
		val2[shift]=0;
if (rsinow>=30.00 && rsib4<= 30.00)
{
	val1[shift]=Low[shift]-5*Point;
}
if (rsib4>=70.00 && rsinow<=70.00)
{
	val2[shift]=High[shift]+5*Point;
}


}
   return(0);
  }
//+------------------------------------------------------------------+
Sample
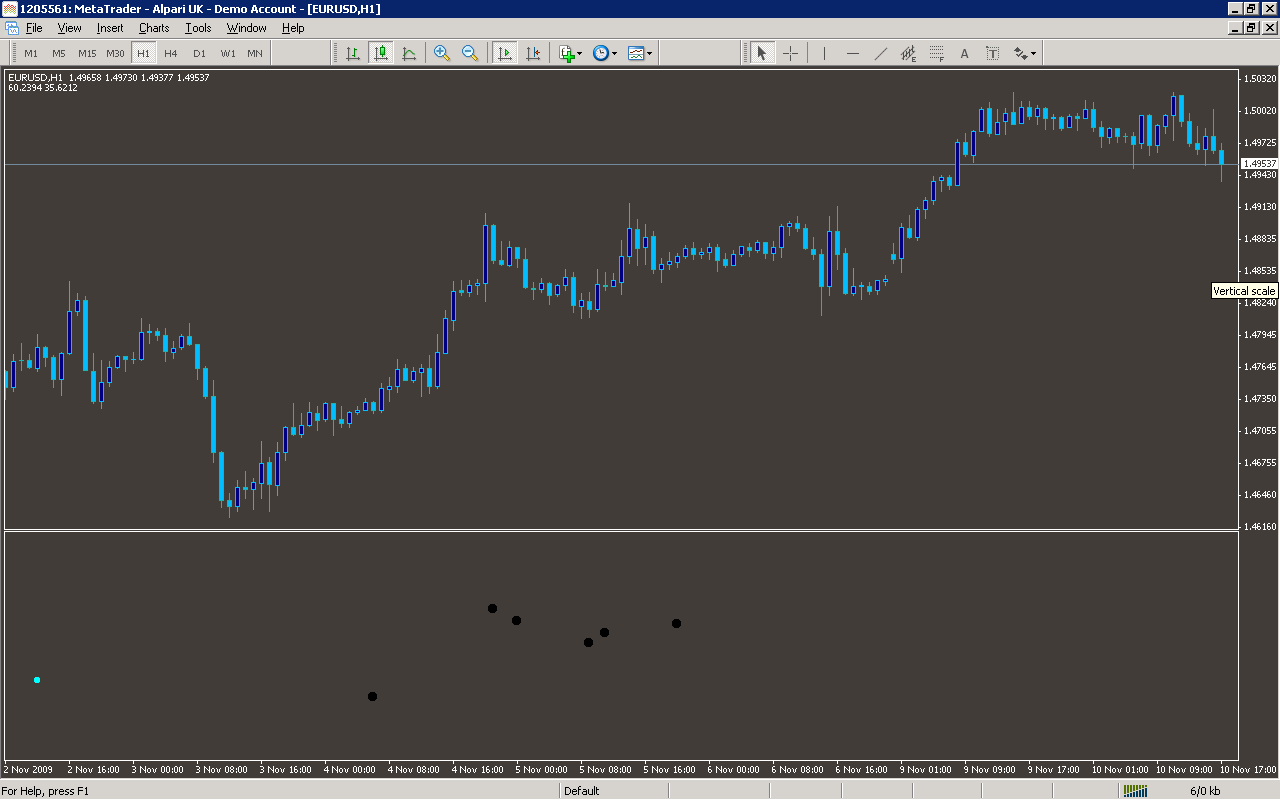
Analysis
Market Information Used:
Series array that contains the lowest prices of each bar
Series array that contains the highest prices of each bar
Indicator Curves created:
Implements a curve of type DRAW_ARROW
Indicators Used:
Custom Indicators Used:
#MTF_RSI
Order Management characteristics:
Other Features: