//http://www.forexfactory.com/showthread.php?p=2181821#post2181821
#property indicator_chart_window
#property indicator_buffers 2

#property indicator_color1 RoyalBlue
#property indicator_color2 OrangeRed
#property indicator_width1 0
#property indicator_width2 0


extern bool AlertOn = false;
extern int SigOffset=15;               // pips above/below high/low to paint arrows

extern int StochK=5;                // Stochastic %K
extern int StochD=3;                // Stochastic %D
extern int StochSlowing=3;          // Stochastic Slowing
extern int StochMethod=MODE_SMA;    // Stochastic Method
extern int StochPrice=0;            // Stochastic Price (0=low/high, 1=close/close)

extern double PSARStep=0.03;        // Parabolic SAR Step
extern double PSARMax=0.2;          // Parabolic SAR Maximum


datetime timenow = 0;
double SignalL[],SignalS[];

//===========================================================================================
//===========================================================================================
int init()
{
 SetIndexBuffer(0,SignalL);
 SetIndexStyle(0, DRAW_ARROW);
 SetIndexArrow(0,SYMBOL_ARROWUP);
 SetIndexBuffer(1,SignalS);
 SetIndexStyle(1, DRAW_ARROW);
 SetIndexArrow(1,SYMBOL_ARROWDOWN);


 return(0);
}
//===========================================================================================
//===========================================================================================
int deinit()
{
 return(0);
}
//===========================================================================================
//===========================================================================================

int start()
{
 int i,imax,counted_bars=IndicatorCounted();
 double ao1,ac1,ao2,ac2,sm1,ss1,sm2,ss2,sar,sar2;
 if(counted_bars>0) imax=Bars-IndicatorCounted();
 else imax=Bars-1;

 for(i=imax;i>=0;i--)
 {
  SignalL[i]=EMPTY_VALUE;
  SignalS[i]=EMPTY_VALUE;

  ao1=iAO(NULL,0,i);
  ao2=iAO(NULL,0,i+1);
  ac1=iAC(NULL,0,i);
  ac2=iAC(NULL,0,i+1);

  sm1=iStochastic(NULL,0,StochK,StochD,StochSlowing,StochMethod,StochPrice,MODE_MAIN,i);
  sm2=iStochastic(NULL,0,StochK,StochD,StochSlowing,StochMethod,StochPrice,MODE_MAIN,i+1);
  ss1=iStochastic(NULL,0,StochK,StochD,StochSlowing,StochMethod,StochPrice,MODE_SIGNAL,i);
  ss2=iStochastic(NULL,0,StochK,StochD,StochSlowing,StochMethod,StochPrice,MODE_SIGNAL,i+1);

  sar=iSAR(NULL,0,PSARStep,PSARMax,i);
  sar2=iSAR(NULL,0,PSARStep,PSARMax,i+1);


 // Stochastic Notes

// Main = %K = Solid/Teal Line
// Signal = %D = Dashed/Red Line

// sm2<limit && sm1>limit = Main line crossed above limit
// sm2>limit && sm1<limit = Main line crossed below limit
// ss2<limit && ss1>limit = Signal line crossed above limit
// ss2>limit && ss1<limit = Signal line crossed below limit

// sm1>ss1&&sm2<ss2 = Stochastic Cross Up
// sm1<ss1&&sm2>ss2 = Stochastic Cross Down

// AC & AO Notes

// ac1>ac2 = Green AC
// ac1<ac2 = Red AC
// ao1>ao2 = Green AO
// ao1<ao2 = Red AO

  if(sm1>ss1 && sar<=iOpen(NULL,0,i))
  {
   if(ac1>ac2 && sar2>=iOpen(NULL,0,i+1)) SignalL[i]=iLow(NULL,0,i)-SigOffset*Point;
  }

  else if(sm1<ss1 && sar>=iOpen(NULL,0,i))
  {
   if(ac1<ac2 && sar2<=iOpen(NULL,0,i+1))SignalS[i]=iHigh(NULL,0,i)+SigOffset*Point;
  }

 }

  if ( timenow != Time[0] && AlertOn )
   {
      if ( SignalL[0] != EMPTY_VALUE )
         {
            Alert( "Green Arrow on ", Symbol()," M",Period());
            timenow = Time[0];
         }
      if ( SignalS[0] != EMPTY_VALUE )
         {
            Alert ( "Red Arrow on ", Symbol()," M",Period());
            timenow = Time[0];
         }
   }


 return(0);
}
//===========================================================================================
//===========================================================================================
Sample
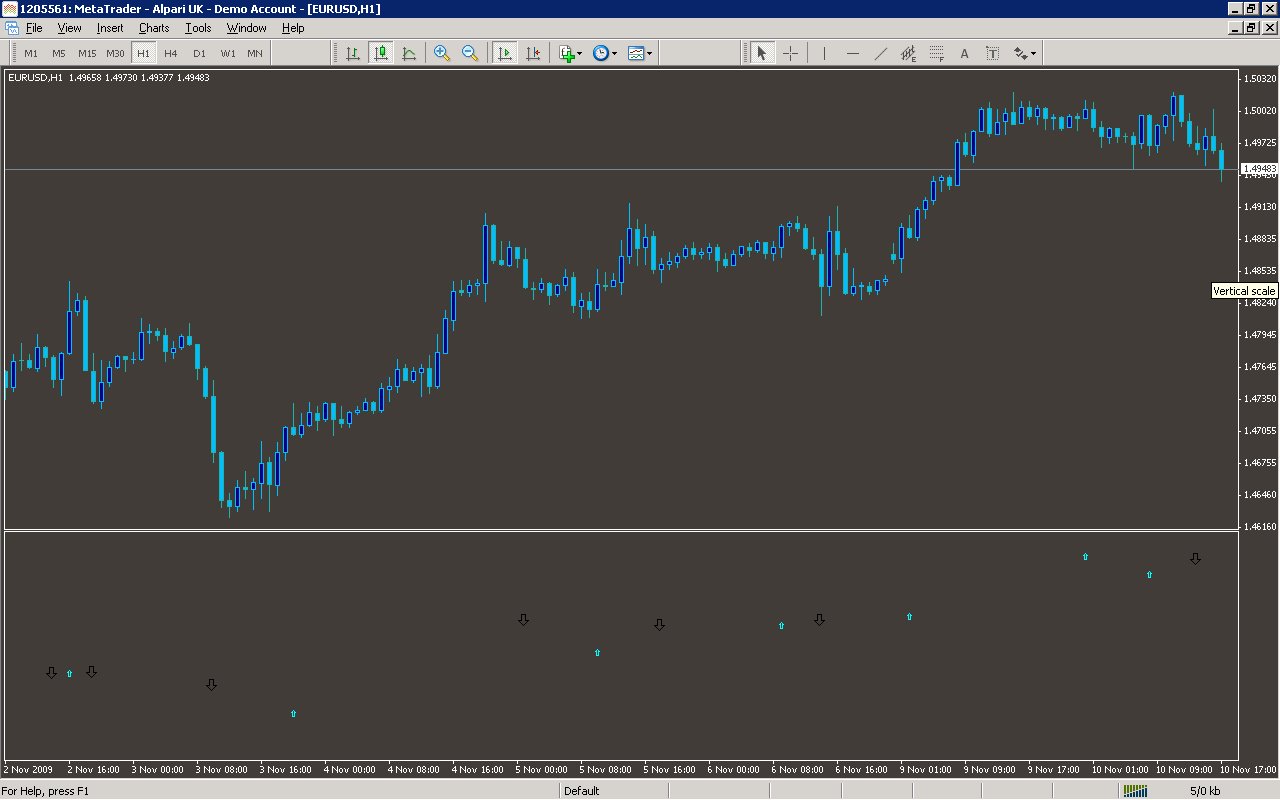
Analysis
Market Information Used:
Series array that contains open prices of each bar
Series array that contains the lowest prices of each bar
Series array that contains the highest prices of each bar
Series array that contains open time of each bar
Indicator Curves created:
Implements a curve of type DRAW_ARROW
Indicators Used:
Bill Williams Awesome oscillator
Bill Williams Accelerator/Decelerator oscillator
Stochastic oscillator
Parabolic Stop and Reverse system
Custom Indicators Used:
Order Management characteristics:
Other Features:
It issuies visual alerts to the screen