//+------------------------------------------------------------------+
//|                                                    StepMA_v2.mq4 |
//|                           Copyright © 2005, TrendLaboratory Ltd. |
//|                                       E-mail: igorad2004@list.ru |
//+------------------------------------------------------------------+
#property copyright "Copyright © 2005, TrendLaboratory Ltd."
#property link      "E-mail: igorad2004@list.ru"

#property indicator_chart_window
#property indicator_buffers 1
#property indicator_color1 Red
//---- input parameters
extern int PeriodWATR=100;
extern double Kwatr=1.0000;
extern int Advance=0;
extern int HighLow=0;
//---- indicator buffers
double LineBuffer[];
//+------------------------------------------------------------------+
//| Custom indicator initialization function                         |
//+------------------------------------------------------------------+
  int init()
  {
   string short_name;
//---- indicator line
   SetIndexStyle(0,DRAW_LINE,STYLE_SOLID,1);
   SetIndexShift(0,Advance);
   SetIndexBuffer(0,LineBuffer);
   IndicatorDigits(MarketInfo(Symbol(),MODE_DIGITS));
//---- name for DataWindow and indicator subwindow label
   short_name="StepMA("+PeriodWATR+")";
   IndicatorShortName(short_name);
   SetIndexLabel(0,"StepMA");
//----
   SetIndexDrawBegin(0,PeriodWATR);
//----
   return(0);
  }

//+------------------------------------------------------------------+
//| StepMA_v2                                                         |
//+------------------------------------------------------------------+
int start()
  {
   int i,shift,trend;
   double smin0,smax0,smin1,smax1,AvgRange,dK,WATR;

   AvgRange=0;
	for (i=PeriodWATR-1;i>=0;i--)
	    {
       dK = 1+1.0*(PeriodWATR-i)/PeriodWATR;
       AvgRange=AvgRange+ dK*MathAbs(High[i]-Low[i]);
       }
	WATR = AvgRange/PeriodWATR;
	int StepSize=Kwatr*WATR/Point;
	Comment(" StepSize = ", StepSize);


   for(shift=Bars-1;shift>=0;shift--)
   {
	if (HighLow>0)
	  {
	  smax0=Low[shift]+2*StepSize*Point;
	  smin0=High[shift]-2*StepSize*Point;

	  if(Close[shift]>smax1) trend=1;
	  if(Close[shift]<smin1) trend=-1;
	  }

	if (HighLow == 0)
	  {
	  smax0=Close[shift]+2*StepSize*Point;
	  smin0=Close[shift]-2*StepSize*Point;

	  if (Close[shift]>smax1)  trend=1;
	  if (Close[shift]<smin1)  trend=-1;
	  }

	  if(trend>0 && smin0<smin1) smin0=smin1;
	  if(trend<0 && smax0>smax1) smax0=smax1;

	  if (trend>0) LineBuffer[shift]=smin0+StepSize*Point;
	  if (trend<0) LineBuffer[shift]=smax0-StepSize*Point;

	  smin1=smin0;
	  smax1=smax0;
	 }
	return(0);
 }
Sample
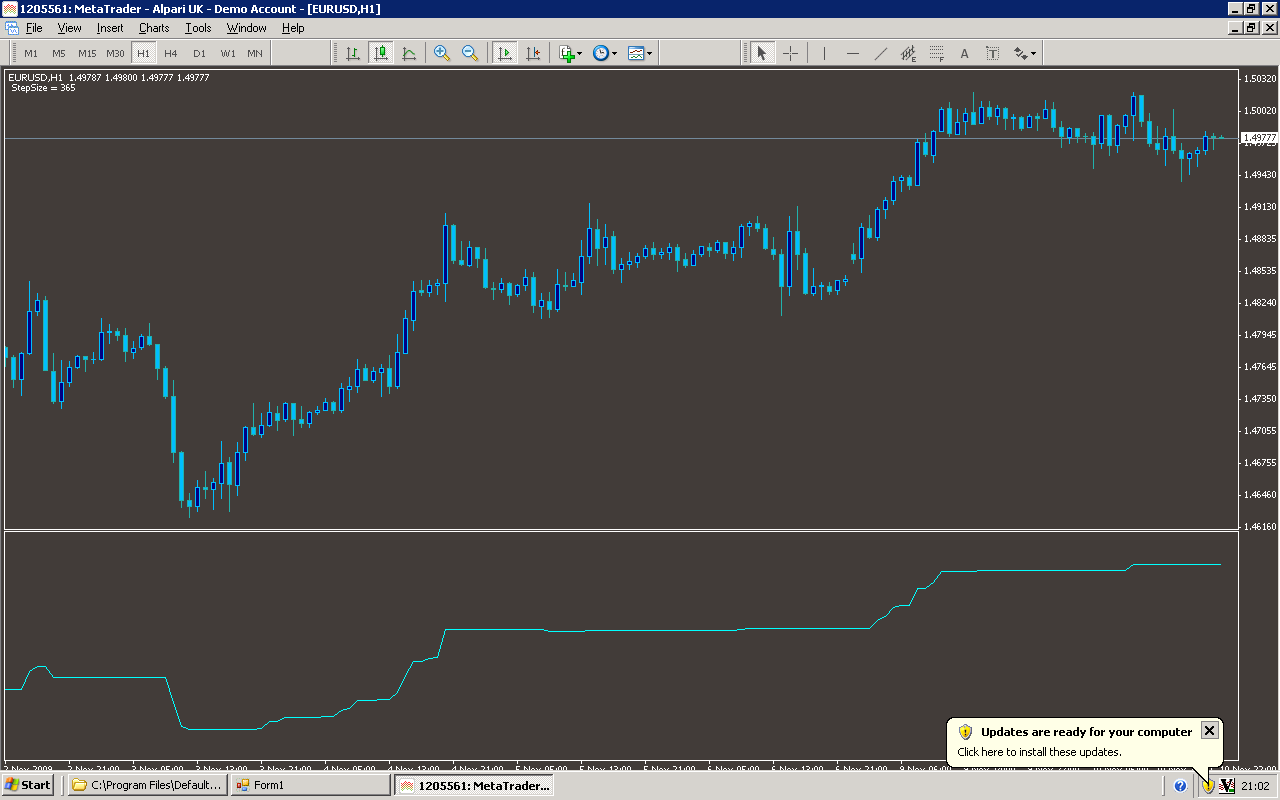
Analysis
Market Information Used:
Series array that contains the highest prices of each bar
Series array that contains the lowest prices of each bar
Series array that contains close prices for each bar
Indicator Curves created:
Implements a curve of type DRAW_LINE
Indicators Used:
Custom Indicators Used:
Order Management characteristics:
Other Features: