//+------------------------------------------------------------------+
// _SR_Barry_FIB_PROJ                                                |
//|                Support and Resistance                            |
//|                Copyright © 2004  Barry Stander                   |
//|                http://myweb.absa.co.za/stander/4meta/            |
//+------------------------------------------------------------------+
#property copyright "Click here: Barry Stander"
#property link      "http://myweb.absa.co.za/stander/4meta/"

#property indicator_chart_window
#property indicator_buffers 6
#property indicator_color1 Red
#property indicator_color2 Blue
#property indicator_color3 Red
#property indicator_color4 Red
#property indicator_color5 Blue
#property indicator_color6 Blue


//---- input parameters

extern bool iPlotChart = false ;
extern bool iPlotGauge = true ;

extern int myPeriod  = 1440 ;
extern int myChartY = 50 ;

extern int       WingDing1 = 226;
extern int       WingDing2 = 225;
extern int       WingDingR = 234;
extern int       WingDingS = 233;
extern double    iLevelP1=0.382;
extern double    iLevelP2=0.618;
extern bool Horizontal = true ;


//---- buffers
double v1[];
double v2[];
double val1;
double val2;
double xBuffer1[];
double xBuffer2[];
double xBuffer3[];
double xBuffer4[];
double xPos[];
double z1[];
double z2[];
int i;

int init()
  {

  IndicatorBuffers(6);

//---- drawing settings
 SetIndexArrow(0, WingDingR);
 SetIndexArrow(1, WingDingS);

   SetIndexStyle(0,DRAW_ARROW,STYLE_DOT,0,Red);
   SetIndexDrawBegin(0,i-1);
   SetIndexBuffer(0, v1);
   SetIndexLabel(0,"Resistance");


   SetIndexStyle(1,DRAW_ARROW,STYLE_DOT,0,Blue);
   SetIndexDrawBegin(1,i-1);
   SetIndexBuffer(1, v2);
   SetIndexLabel(1,"Support");


   SetIndexStyle(2,DRAW_ARROW);
   SetIndexArrow(2,WingDing1);
   SetIndexBuffer(2,xBuffer1);
   SetIndexEmptyValue(2,0.0);
   SetIndexStyle(3,DRAW_ARROW);
   SetIndexArrow(3,WingDing1);
   SetIndexBuffer(3,xBuffer2);
   SetIndexEmptyValue(3,0.0);
   SetIndexStyle(4,DRAW_ARROW);
   SetIndexArrow(4,WingDing2);
   SetIndexBuffer(4,xBuffer3);
   SetIndexEmptyValue(4,0.0);
   SetIndexStyle(5,DRAW_ARROW);
   SetIndexArrow(5,WingDing2);
   SetIndexBuffer(5,xBuffer4);
   SetIndexEmptyValue(5,0.0);


   return(0);
  }

//+------------------------------------------------------------------+
//| Custom indicator deinitialization function                       |
//+------------------------------------------------------------------+
int deinit()
  {

   ObjectDelete("SupRes");
   ObjectDelete("line5SupRes");
   ObjectDelete("R3_Lab");
   ObjectDelete("R3_Val");
   ObjectDelete("R2_Lab");
   ObjectDelete("R2_Val");
   ObjectDelete("R1_Lab");
   ObjectDelete("R1_Val");
   ObjectDelete("Pivot_Lab");
   ObjectDelete("Pivot_Val");

   return(0);
  }

int start()
  {

   i=Bars;
   while(i>=0)
     {


val1 = iFractals(NULL, myPeriod, MODE_UPPER, i);
//----
if(val1 > 0) {
v1[i] = High[i];
double R3 = v1[i] ; }
else
if (Horizontal) {v1[i] = v1[i+1]; }


val2 = iFractals(NULL, myPeriod, MODE_LOWER, i);
//----
if(val2 > 0) {
v2[i] = Low[i];
double R2 = v2[i] ; }
else
if (Horizontal) {v2[i] = v2[i+1]; }


if ( iPlotChart ) {


                  double Range = v1[i] - v2[i];
                  xBuffer1[i] = v1[i] + (Range*iLevelP2) ;
                  xBuffer2[i] = v1[i] + (Range*iLevelP1) ;
                  xBuffer3[i] = v2[i] - (Range*iLevelP1) ;
                  xBuffer4[i] = v2[i] - (Range*iLevelP2) ;

} // iPlotChart

      i--;
     }  // while

if ( iPlotGauge ) {
double xRet = Close[0] - R2 ;

double xRetPct =  ( 100 * xRet ) / ( R3 - R2 );


//+------------------------------------------------------------------+
   color color_title   =White;
   color color_res     =Red;
   color color_sup     =Blue;
   color color_ret     =White;
   color color_retpct  =White;

   color color_r3=Red;
   color color_r2=Red;
   color color_r1=White;
   color color_p =White;

	if( Close[0] < R3) { color_r3=Lime; }
	if( Close[0] < R2) { color_r2=Lime; }

	int Precision, dig;

   if( StringFind( Symbol(), "JPY", 0) != -1 ) { Precision = 100; dig = 2;}
   else                                        { Precision = 10000; dig = 4; }


int sPeriod= Period();

if (myPeriod != NULL){ sPeriod= myPeriod ; color_title=Yellow;}


//---- Set Pivots labels

   int WindowToUse;
   int Corner_line, Xdist_line;
   int Corner_text, Corner_value, Xdist_text, Xdist_value;
   int Ydist_line5;
   int Corner_pivots, Xdist_pivots, Ydist_pivots;
   int Ydist_R3, Ydist_R2, Ydist_R1, Ydist_PV, Ydist_S1, Ydist_S2, Ydist_S3;

   int YdistInc ;
    WindowToUse =  0;
    Corner_line = 1;
    Corner_text = 1; Corner_value = 1;
    Xdist_line = 21; Xdist_text = 93; Xdist_value = 23;
    Corner_pivots = 1; Xdist_pivots = 21;
    Ydist_pivots = myChartY;
    Ydist_line5 = Ydist_pivots + 11; YdistInc = 15 ;
    Ydist_R3 = Ydist_pivots + 25;
    Ydist_R2 = Ydist_R3 + YdistInc;
    Ydist_R1 = Ydist_R3 + YdistInc*2;
    Ydist_PV = Ydist_R3 + YdistInc*3;
    Ydist_S1 = Ydist_R3 + YdistInc*4;
    Ydist_S2 = Ydist_R3 + YdistInc*5;
    Ydist_S3 = Ydist_R3 + YdistInc*6;

   ObjectCreate("SupRes", OBJ_LABEL, WindowToUse, 0, 0);
   ObjectSetText("SupRes",sPeriod + " SR Fib Proj ",9, "Verdana", color_title);
   ObjectSet("SupRes", OBJPROP_CORNER, Corner_pivots);
   ObjectSet("SupRes", OBJPROP_XDISTANCE, Xdist_pivots);
   ObjectSet("SupRes", OBJPROP_YDISTANCE, Ydist_pivots);

   ObjectCreate("line5SupRes", OBJ_LABEL, WindowToUse, 0, 0);
   ObjectSetText("line5SupRes","---------------------",7, "Verdana", color_title);
   ObjectSet("line5SupRes", OBJPROP_CORNER, Corner_line);
   ObjectSet("line5SupRes", OBJPROP_XDISTANCE, Xdist_line);
   ObjectSet("line5SupRes", OBJPROP_YDISTANCE, Ydist_line5);

   ObjectCreate("R3_Lab", OBJ_LABEL, WindowToUse, 0, 0);
   ObjectSetText("R3_Lab","Res  ",9, "Verdana", color_res);
   ObjectSet("R3_Lab", OBJPROP_CORNER, Corner_text);
   ObjectSet("R3_Lab", OBJPROP_XDISTANCE, Xdist_text);
   ObjectSet("R3_Lab", OBJPROP_YDISTANCE, Ydist_R3);

   ObjectCreate("R3_Val", OBJ_LABEL, WindowToUse, 0, 0);
   ObjectSetText("R3_Val"," "+DoubleToStr(R3,dig),9, "Verdana", color_r3);
   ObjectSet("R3_Val", OBJPROP_CORNER, Corner_value);
   ObjectSet("R3_Val", OBJPROP_XDISTANCE, Xdist_value);
   ObjectSet("R3_Val", OBJPROP_YDISTANCE, Ydist_R3);

   ObjectCreate("R2_Lab", OBJ_LABEL, WindowToUse, 0, 0);
   ObjectSetText("R2_Lab","Sup  ",9, "Verdana", color_sup);
   ObjectSet("R2_Lab", OBJPROP_CORNER, Corner_text);
   ObjectSet("R2_Lab", OBJPROP_XDISTANCE, Xdist_text);
   ObjectSet("R2_Lab", OBJPROP_YDISTANCE, Ydist_R2);

   ObjectCreate("R2_Val", OBJ_LABEL, WindowToUse, 0, 0);
   ObjectSetText("R2_Val"," "+DoubleToStr(R2,dig),9, "Verdana", color_r2);
   ObjectSet("R2_Val", OBJPROP_CORNER, Corner_value);
   ObjectSet("R2_Val", OBJPROP_XDISTANCE, Xdist_value);
   ObjectSet("R2_Val", OBJPROP_YDISTANCE, Ydist_R2);

   ObjectCreate("R1_Lab", OBJ_LABEL, WindowToUse, 0, 0);
   ObjectSetText("R1_Lab","Ret  ",9, "Verdana", color_r1 );
   ObjectSet("R1_Lab", OBJPROP_CORNER, Corner_text);
   ObjectSet("R1_Lab", OBJPROP_XDISTANCE, Xdist_text);
   ObjectSet("R1_Lab", OBJPROP_YDISTANCE, Ydist_R1);

   ObjectCreate("R1_Val", OBJ_LABEL, WindowToUse, 0, 0);
   ObjectSetText("R1_Val"," "+DoubleToStr(xRet,dig),9, "Verdana", color_r1);
   ObjectSet("R1_Val", OBJPROP_CORNER, Corner_value);
   ObjectSet("R1_Val", OBJPROP_XDISTANCE, Xdist_value);
   ObjectSet("R1_Val", OBJPROP_YDISTANCE, Ydist_R1);

   ObjectCreate("Pivot_Lab", OBJ_LABEL, WindowToUse, 0, 0);
   ObjectSetText("Pivot_Lab","Ret%",9, "Verdana", White);
   ObjectSet("Pivot_Lab", OBJPROP_CORNER, Corner_text);
   ObjectSet("Pivot_Lab", OBJPROP_XDISTANCE, Xdist_text);
   ObjectSet("Pivot_Lab", OBJPROP_YDISTANCE, Ydist_PV);

   ObjectCreate("Pivot_Val", OBJ_LABEL, WindowToUse, 0, 0);
   ObjectSetText("Pivot_Val"," "+DoubleToStr(xRetPct,dig),9, "Verdana", color_p);
   ObjectSet("Pivot_Val", OBJPROP_CORNER, Corner_value);
   ObjectSet("Pivot_Val", OBJPROP_XDISTANCE, Xdist_value);
   ObjectSet("Pivot_Val", OBJPROP_YDISTANCE, Ydist_PV);

} // iPlotGauge

   return(0);
}
Sample
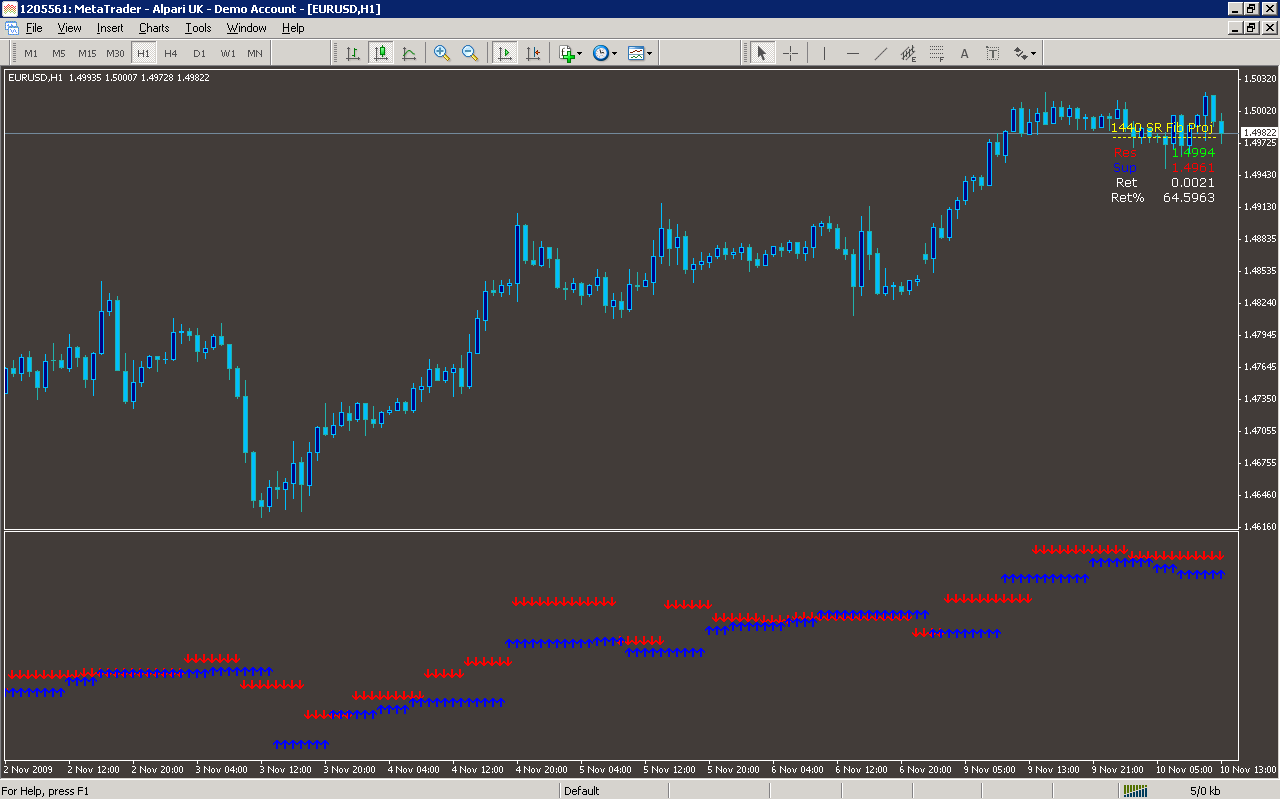
Analysis
Market Information Used:
Series array that contains the highest prices of each bar
Series array that contains the lowest prices of each bar
Series array that contains close prices for each bar
Indicator Curves created:
Implements a curve of type DRAW_ARROW
Indicators Used:
Fractals
Custom Indicators Used:
Order Management characteristics:
Other Features: