//+------------------------------------------------------------------+
//|                                                  Supertrend2.mq4 |
//|                   Copyright © 2005, Jason Robinson (jnrtrading). |
//|                                      http://www.jnrtrading.co.uk |
//+------------------------------------------------------------------+
#property copyright "Copyright © 2005, Jason Robinson (jnrtrading)."
#property link      "http://www.jnrtrading.co.uk"

#property indicator_chart_window
#property indicator_buffers 3
#property indicator_color1 Lime
#property indicator_color2 Red
#property indicator_color3 Orange
#property indicator_width1 2
#property indicator_width2 2
#property indicator_width3 2

double TrendUp[], TrendDown[], Price1[], Price2[], AvgPrice[], Trend[];
int UpDownShift;
double price1, price2;

extern int NbPeriods = 10;
extern bool Display_SuperTrend = true;
extern bool Display_Average_Price_Line = true;
extern bool Automatic_Timeframe_Settings = false;
extern int M1_NbPeriods = 10;
extern int M5_NbPeriods = 10;
extern int M15_NbPeriods = 10;
extern int M30_NbPeriods = 10;
extern int H1_NbPeriods = 10;
extern int H4_NbPeriods = 10;
extern int D1_NbPeriods = 10;
extern int W1_NbPeriods = 10;
extern int MN_NbPeriods = 10;
//+------------------------------------------------------------------+
//| Custom indicator initialization function                         |
//+------------------------------------------------------------------+
int init()
  {
//---- indicators

   IndicatorBuffers(6);
   SetIndexBuffer(0, TrendUp);
   SetIndexStyle(0, DRAW_LINE, STYLE_SOLID);
   SetIndexBuffer(1, TrendDown);
   SetIndexStyle(1, DRAW_LINE, STYLE_SOLID);
   SetIndexBuffer(2, AvgPrice);
   SetIndexStyle(2, DRAW_LINE, STYLE_SOLID);
   SetIndexBuffer(3, Price1);
   SetIndexBuffer(4, Price2);
   SetIndexBuffer(5, Trend);
     SetIndexLabel(0,"ST2("+NbPeriods+")TrendUp");
     SetIndexLabel(1,"ST2("+NbPeriods+")TrendDn");
     SetIndexLabel(2,"ST2("+NbPeriods+")AvgPrice");
    IndicatorShortName("Super_Trend2");

   /*switch(Period()) {
      case 1:     UpDownShift = 5;   break;
      case 5:     UpDownShift = 9;  break;
      case 15:    UpDownShift = 10;   break;
      case 30:    UpDownShift = 11;   break;
      case 60:    UpDownShift = 30;  break;
      case 240:   UpDownShift = 45;  break;
      case 1440:  UpDownShift = 55;  break;
      case 10080: UpDownShift = 150; break;
      case 43200: UpDownShift = 350; break;
   }*/
//----
   return(0);
  }
//+------------------------------------------------------------------+
//| Custor indicator deinitialization function                       |
//+------------------------------------------------------------------+
int deinit()
  {
//----

//----
   return(0);
  }
//+------------------------------------------------------------------+
//| Custom indicator iteration function                              |
//+------------------------------------------------------------------+
int start()
  {
   int limit, i, j, shift;
   double Price3;
   int counted_bars = IndicatorCounted();
//---- check for possible errors
   if(counted_bars < 0) return(-1);
//---- last counted bar will be recounted
   if(counted_bars > 0) counted_bars--;

   limit=Bars-counted_bars;

   if (Automatic_Timeframe_Settings == true) {
      switch(Period()) {
         case 1:     NbPeriods = M1_NbPeriods;   break;
         case 5:     NbPeriods = M5_NbPeriods;  break;
         case 15:    NbPeriods = M15_NbPeriods;   break;
         case 30:    NbPeriods = M30_NbPeriods;   break;
         case 60:    NbPeriods = H1_NbPeriods;  break;
         case 240:   NbPeriods = H4_NbPeriods;  break;
         case 1440:  NbPeriods = D1_NbPeriods;  break;
         case 10080: NbPeriods = W1_NbPeriods; break;
         case 43200: NbPeriods = MN_NbPeriods; break;
      }
   }

   for (i = limit; i >= 0; i--) {
      Price1[i] = 0;
      Price2[i] = 0;
      for(j = 0; j < NbPeriods; j++) {
         Price1[i] = Price1[i] + ((High[i+j] + Low[i+j] + Close[i+j])/3);
      }
      Price1[i] = Price1[i] / NbPeriods;
      for(j = NbPeriods; j < (NbPeriods*2); j++) {
         Price2[i] = Price2[i] + ((High[i+j] + Low[i+j] + Close[i+j])/3);
      }
      Price2[i] = Price2[i] / NbPeriods;
   }
   for (i = limit; i >= 0; i--) {
      if (Price1[i] > Price2[i]) Trend[i] = 90;
      if (Price1[i] < Price2[i]) Trend[i] = 10;
      if (Trend[i+1] > Trend[i] && Trend[i+1] > Trend[i+2]) Trend[i+1] = 10;
      if (Trend[i+1] < Trend[i] && Trend[i+1] < Trend[i+2]) Trend[i+1] = 90;
   }
   for (i = limit; i >= 0; i--) {
      price1 = (High[i] + Low[i] + Close[i])/3;
      price2 = (High[i+1] + Low[i+1] + Close[i+1])/3;
      if (Display_Average_Price_Line == true) AvgPrice[i] = (Price1[i] + Price2[i])/2;
      if (Display_SuperTrend == true) {
         if(Trend[i] == 90) {
            TrendDown[i] = EMPTY_VALUE;
            if(TrendDown[i+1] != EMPTY_VALUE) TrendUp[i+1] = TrendDown[i+1];
            TrendUp[i] = Low[i] - iATR(NULL,0,10,i);// Point*UpDownShift;
            if (price1 < price2 && TrendDown[i+1] != TrendUp[i+1]) TrendUp[i] = TrendUp[i+1];
            if (Close[i] < Close[i+1] && TrendDown[i+1] != TrendUp[i+1]) TrendUp[i] = TrendUp[i+1];
            if (High[i] < High[i+1] && TrendDown[i+1] != TrendUp[i+1]) TrendUp[i] = TrendUp[i+1];
            if (TrendUp[i] < TrendUp[i+1] && TrendUp[i+1] != TrendDown[i+1]) TrendUp[i] = TrendUp[i+1];
         }
         if(Trend[i] == 10) {
            TrendUp[i] = EMPTY_VALUE;
            if(TrendUp[i+1] != EMPTY_VALUE) TrendDown[i+1] = TrendUp[i+1];
            TrendDown[i] = High[i] + iATR(NULL,0,10,i);// Point*UpDownShift;
            if (price1 > price2 && TrendDown[i+1] != TrendUp[i+1]) TrendUp[i] = TrendUp[i+1];
            if (Close[i] > Close[i+1] && TrendDown[i+1] != TrendUp[i+1]) TrendUp[i] = TrendUp[i+1];
            if (Low[i] > Low[i+1] && TrendUp[i+1] != TrendDown[i+1]) TrendDown[i] = TrendDown[i+1];
            if (TrendDown[i] > TrendDown[i+1] && TrendUp[i+1] != TrendDown[i+1]) TrendDown[i] = TrendDown[i+1];
         }
      }
   }
//----

//----
   return(0);
  }
//+------------------------------------------------------------------+
Sample
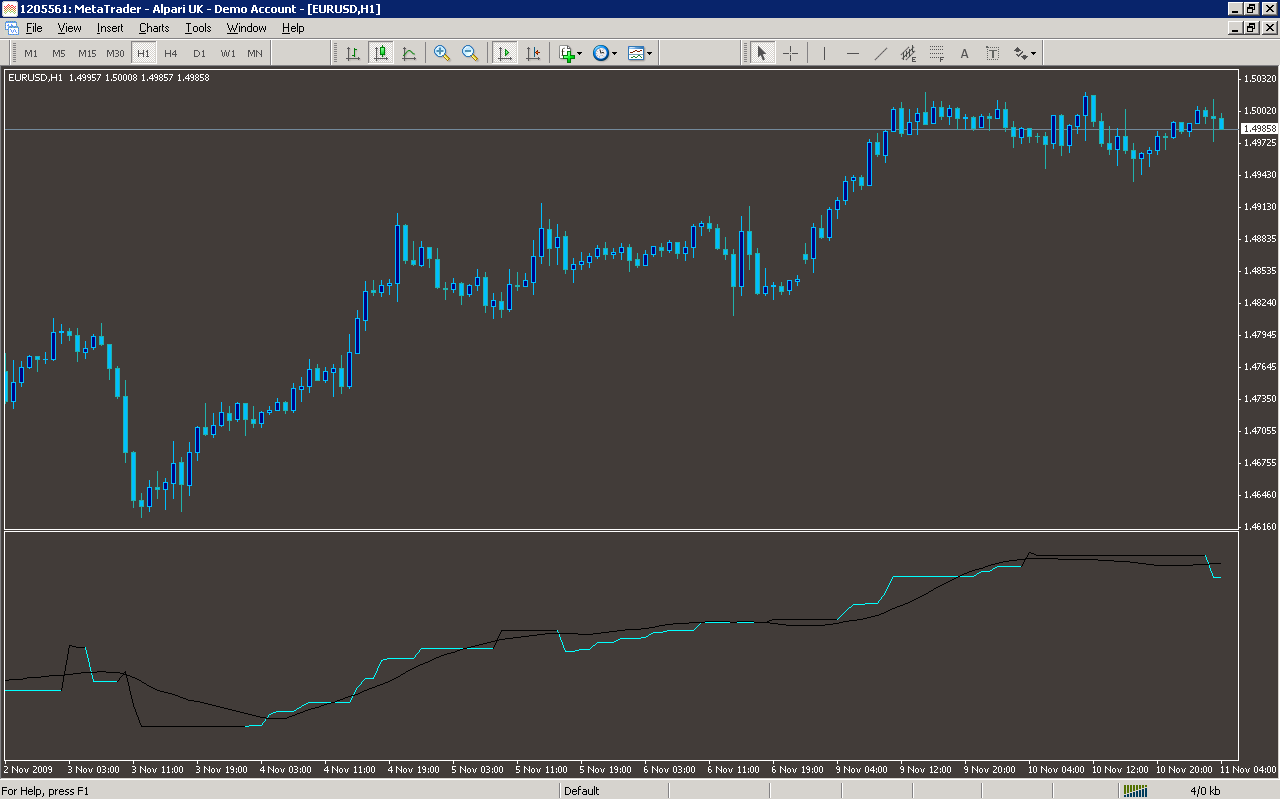
Analysis
Market Information Used:
Series array that contains close prices for each bar
Series array that contains the highest prices of each bar
Series array that contains the lowest prices of each bar
Indicator Curves created:
Implements a curve of type DRAW_LINE
Indicators Used:
Indicator of the average true range
Custom Indicators Used:
Order Management characteristics:
Other Features: