//+------------------------------------------------------------------+
//| T3.mq4 |
//| MojoFX |
//| http://groups.yahoo.com/group/MetaTrader_Experts_and_Indicators/ |
//+------------------------------------------------------------------+
#property copyright "MojoFX - Conversion only"
#property link "http://groups.yahoo.com/group/MetaTrader_Experts_and_Indicators/"

#property indicator_chart_window
#property indicator_buffers 1
#property indicator_color1 Red

extern int MA_Period = 14;
extern double b = 0.7;


double MapBuffer[];

double e1[],e2[],e3[],e4[],e5[],e6[];
double c1,c2,c3,c4;
double n,w1,w2,b2,b3;

//+------------------------------------------------------------------+
//| Custom indicator initialization function |
//+------------------------------------------------------------------+
int init()
{
//---- indicators setting
SetIndexStyle(0,DRAW_LINE,STYLE_SOLID,1,Red);
IndicatorDigits(MarketInfo(Symbol(),MODE_DIGITS));
IndicatorShortName("T3"+MA_Period);
SetIndexDrawBegin(0,100);
SetIndexBuffer(0,MapBuffer);


//---- variable reset
//e2=0; e3=0; e4=0; e5=0; e6=0;
c1=0; c2=0; c3=0; c4=0;
n=0;
w1=0; w2=0;
b2=0; b3=0;

b2=b*b;
b3=b2*b;
c1=-b3;
c2=(3*(b2+b3));
c3=-3*(2*b2+b+b3);
c4=(1+3*b+b3+3*b2);
n=MA_Period;

if (n<1) n=1;
n = 1 + 0.5*(n-1);
w1 = 2 / (n + 1);
w2 = 1 - w1;

//----
return(0);
}

//+------------------------------------------------------------------+
//| Custom indicator iteration function |
//+------------------------------------------------------------------+
int start()
{
int limit;
int counted_bars=IndicatorCounted();
if (counted_bars<0) return (-1);
if (counted_bars>0) counted_bars--;
limit=(Bars-counted_bars)-1;

//---- indicator calculation
ArrayResize(e1, Bars+1);
ArrayResize(e2, Bars+1);
ArrayResize(e3, Bars+1);
ArrayResize(e4, Bars+1);
ArrayResize(e5, Bars+1);
ArrayResize(e6, Bars+1);

for(int i=limit; i>=0; i--)
{
e1[Bars-i] = w1*Close[i] + w2*e1[(Bars-i)-1];
e2[Bars-i] = w1*e1[Bars-i] + w2*e2[(Bars-i)-1];
e3[Bars-i] = w1*e2[Bars-i] + w2*e3[(Bars-i)-1];
e4[Bars-i] = w1*e3[Bars-i] + w2*e4[(Bars-i)-1];
e5[Bars-i] = w1*e4[Bars-i] + w2*e5[(Bars-i)-1];
e6[Bars-i] = w1*e5[Bars-i] + w2*e6[(Bars-i)-1];
//Print ("I- ",i, "Bars-I ",Bars-i);
MapBuffer[i]=c1*e6[Bars-i] + c2*e5[Bars-i] + c3*e4[Bars-i] + c4*e3[Bars-i];
}
//----
return(0);
}
//+------------------------------------------------------------------+
Sample
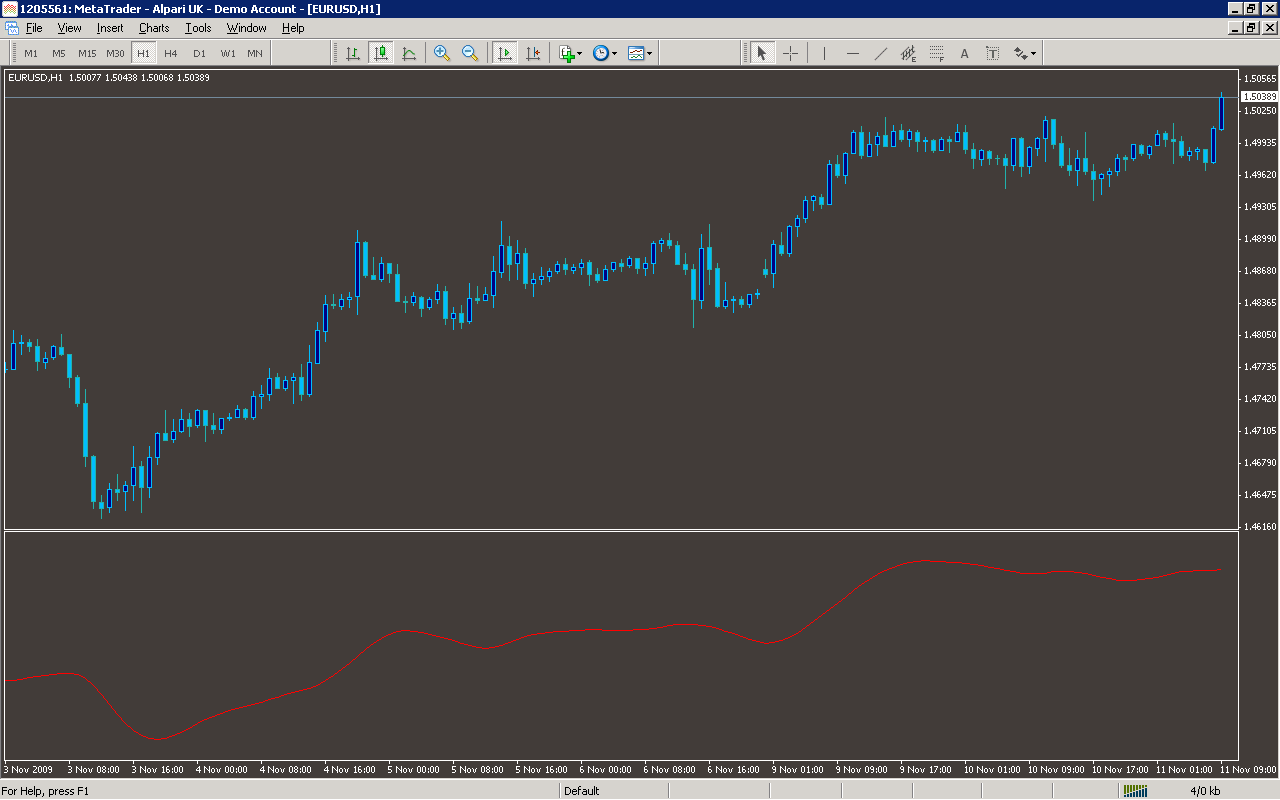
Analysis
Market Information Used:
Series array that contains close prices for each bar
Indicator Curves created:
Implements a curve of type DRAW_LINE
Indicators Used:
Custom Indicators Used:
Order Management characteristics:
Other Features: