//+------------------------------------------------------------------+
//|                                                     TD Pivot.mq4 |
//+------------------------------------------------------------------+
#property indicator_chart_window
#property indicator_buffers 2
#property indicator_color1 RoyalBlue
#property indicator_color2 OrangeRed

//---- buffers
double high[],
       low[];

//+------------------------------------------------------------------+
//| Custom indicator initialization function                         |
//+------------------------------------------------------------------+
int init()
{
   IndicatorShortName("TD Pivot");
//---- indicators
   SetIndexLabel (0,"High");
   SetIndexStyle (0,DRAW_LINE);
   SetIndexBuffer(0,high);
   SetIndexLabel (1,"Low");
   SetIndexStyle (1,DRAW_LINE);
   SetIndexBuffer(1,low);
//----
   return(0);
}

//+------------------------------------------------------------------+
//| Custom indicator iteration function                              |
//+------------------------------------------------------------------+
int start()
{
//----
   for (int i = Bars-IndicatorCounted(); i >= 0; i--)
   {
      if(TimeHour(iTime(NULL,0,i)) != 0)
      {
         high[i] = high[i+1];
         low[i]  = low[i+1];
         continue;
      }

      int candlesPerDay = PERIOD_D1/Period(),
          day           = MathFloor(i/candlesPerDay)+1;

      double H = iHigh(NULL,PERIOD_D1,day),
             L = iLow(NULL,PERIOD_D1,day),
             O = iOpen(NULL,PERIOD_D1,day),
             C = iClose(NULL,PERIOD_D1,day),
             X;

      if      (C < O)  X =   H + 2*L +   C;
      else if (C > O)  X = 2*H +   L +   C;
      else if (C ==O)  X =   H +   L + 2*C;

      high[i] = 0.5*X - L;
      low[i]  = 0.5*X - H;
   }
//----
   return(0);
}
//+------------------------------------------------------------------+
Sample
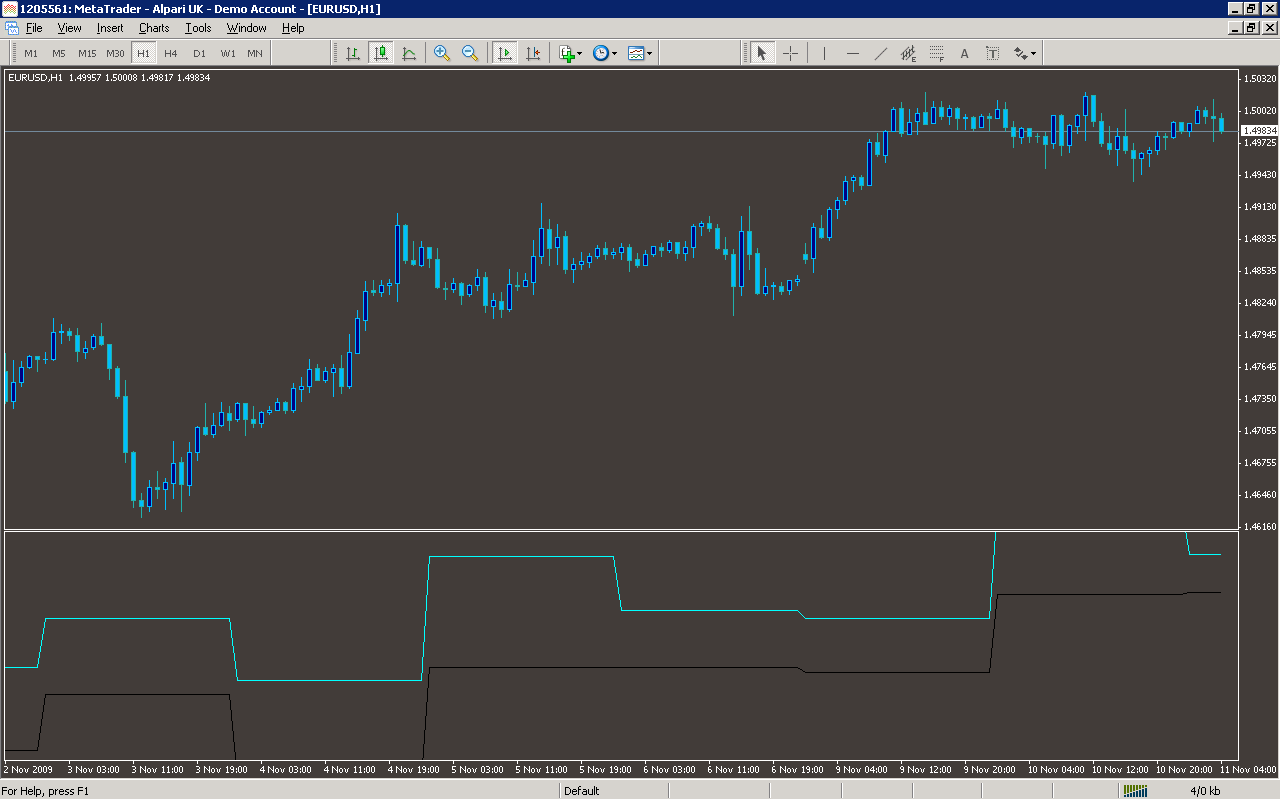
Analysis
Market Information Used:
Series array that contains the highest prices of each bar
Series array that contains the lowest prices of each bar
Series array that contains open prices of each bar
Series array that contains close prices for each bar
Indicator Curves created:
Indicators Used:
Custom Indicators Used:
Order Management characteristics:
Other Features: