//+------------------------------------------------------------------+
//|                                             Corrected SMA II.mq4 |
//|                                     Copyright © 2007, Amir Aliev |
//|                                       http://finmat.blogspot.com/ |
//+------------------------------------------------------------------+
#property copyright "Copyright © 2007, Amir Aliev"
#property link      "http://finmat.blogspot.com/"

#property indicator_chart_window
#property indicator_color1 Red
//---- input parameters
extern int MA_Ticks = 1000;
//---- indicator buffers
double sum = 0;
int ticks = 0;
bool collected = false;
bool started = false;
int fbar = 0;
double ExtMapBuffer[];
int oldRange = 0;
int lbarVol = 0;
int period;
//+------------------------------------------------------------------+
//| Custom indicator initialization function                         |
//+------------------------------------------------------------------+
int init()
  {
//----
   SetIndexStyle(0, DRAW_LINE);
//---- indicator buffers mapping
   SetIndexBuffer(0, ExtMapBuffer);
//---- initialization done

   return(0);
  }
//+------------------------------------------------------------------+
//| Custom indicator iteration function                              |
//+------------------------------------------------------------------+
int start()
  {
   int rest = Bars - IndicatorCounted();
   if(! rest)
       return (0);

   if (period!=Period())
   {
      Print("Period has been changed. Recalculation needed");
      rest=Bars;
   }
   period=Period();

   if (Volume[ArrayMaximum(Volume)] > MA_Ticks)
   {
      MA_Ticks = Volume[ArrayMaximum(Volume)] +1 ;
   Print ("MA_Ticks is too low for this period. MA_ticks has been changed to ",MA_Ticks);
   }
 /*
   Print("Ticks = ", ticks);
   Print("Rest = ", rest);
   Print("fbar = ", fbar);
*/
   rest--;
   fbar += rest;
   while(!collected && (rest >= 0))
     {
      if(ticks + Volume[rest] < MA_Ticks)
        {
         ticks += Volume[rest];
         sum += Volume[rest] * (High[rest]+Low[rest])/2;
         if(!started)
           {
            fbar = rest;
            started = true;
           }
         rest--;
         continue;
        }
      collected = true;
     }
   if(! collected)
       return (0);

   ticks += (Volume[rest] - lbarVol);
   sum += (Volume[rest] - lbarVol) * (High[rest]+Low[rest])/2;
   lbarVol = Volume[rest];
   while(ticks > MA_Ticks)
     {
       //Print("fbar-- because bar ticks reaches 1000");
       ticks -= Volume[fbar];
       sum -= Volume[fbar] * (High[fbar]+Low[fbar])/2;
       fbar--;
     }
   if (ticks!=0) ExtMapBuffer[rest] = sum / ticks;
   rest--;


   while(rest >= 0)
     {
      ticks += Volume[rest];
      sum += Volume[rest] * (High[rest]+Low[rest])/2;
      lbarVol = Volume[rest];
      while(ticks > MA_Ticks)
        {
         //Print("fbar-- because of new bar ");
         ticks -= Volume[fbar];
         sum -= Volume[fbar] * (High[fbar]+Low[fbar])/2;
         fbar--;
        }
      if (ticks!=0) ExtMapBuffer[rest] = sum / ticks;
      rest--;
     }
//----
   return(0);
  }
//+------------------------------------------------------------------+
Sample
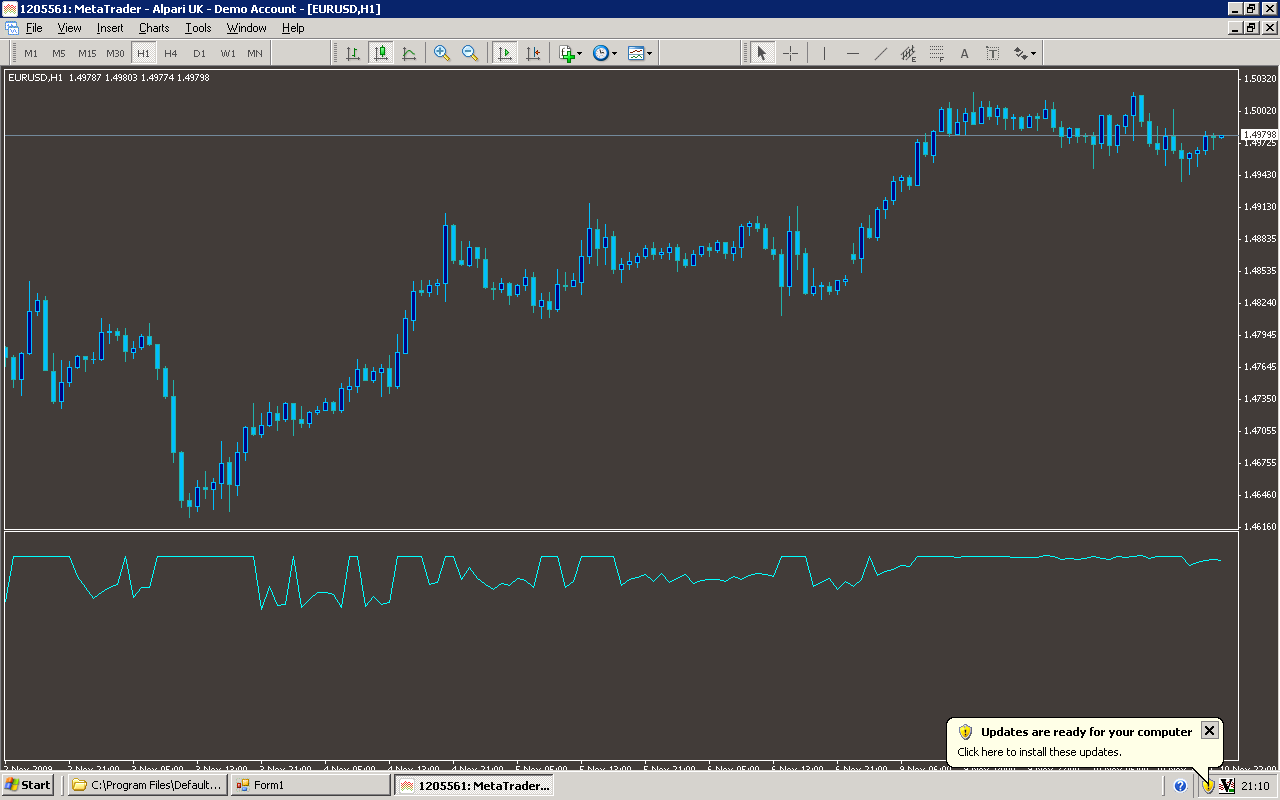
Analysis
Market Information Used:
Series array that contains tick volumes of each bar
Series array that contains the highest prices of each bar
Series array that contains the lowest prices of each bar
Indicator Curves created:
Implements a curve of type DRAW_LINE
Indicators Used:
Custom Indicators Used:
Order Management characteristics:
Other Features: