//+------------------------------------------------------------------+
//|                                         Time Series Forecast.mq4 |
//|                      Copyright © 2006, MetaQuotes Software Corp. |
//|                                        http://www.metaquotes.net |
//+------------------------------------------------------------------+
#property copyright "Copyright © 2006, MetaQuotes Software Corp."
#property link      "http://www.metaquotes.net"

#property indicator_chart_window
#property indicator_buffers 1
#property indicator_color1 Red
//---- input parameters
extern int TSFPeriod = 20;
//---- buffers
double ExtMapBuffer1[];
//+------------------------------------------------------------------+
//| Custom indicator initialization function                         |
//+------------------------------------------------------------------+
int init()
  {
//---- indicators
   SetIndexStyle(0,DRAW_LINE);
   SetIndexBuffer(0,ExtMapBuffer1);
//----
   return(0);
  }
//+------------------------------------------------------------------+
//| Custom indicator deinitialization function                       |
//+------------------------------------------------------------------+
int deinit()
  {
//----

//----
   return(0);
  }
//+------------------------------------------------------------------+
//| Custom indicator iteration function                              |
//+------------------------------------------------------------------+
int start()
  {
   int    counted_bars=IndicatorCounted();
//----
   double ka,kb,sx,sy,sxy,sx2,ival;
   int cnt;

   int i,limit;

     limit=Bars-TSFPeriod-counted_bars;
  //---- main loop
     for(i=limit; i>=0; i--)

   {
	sy=0;
	sx=0;
	sxy=0;
	sx2=0;
	for (cnt=1; cnt<= TSFPeriod; cnt++)
	{
		sy+=Close[i+cnt-1];
		sx+=cnt;
		sx2+=cnt*cnt;
		sxy+=Close[i+cnt-1]*cnt;
	}
	kb=(TSFPeriod*sxy-sx*sy)/(TSFPeriod*sx2-sx*sx);
	ka=(sy-kb*sx)/TSFPeriod;
	ival=ka+kb;
	ExtMapBuffer1[i] = ival;
}

//----
   return(0);
  }
//+------------------------------------------------------------------+
/*
extern int ndot=21;


bool is_First=true;

SetLoopCount(0);

// Check for additional bars loading or total reloadng.
If Bars<prevbars or Bars-prevbars>1 Then is_First=True;
prevbars=Bars;
//--------------------------------------------------------

// Pre-Loop setup
// loopbegin prevents counting of previously plotted bars excluding current Bars
if is_First Then Begin
   LoopBegin=bars-ndot-2;
   is_First=False;
End;
//--------------------------------------------------------

loopBegin++; // Plot the current bar also
// loop from first bar to current bar (with shift=0)
For shift=loopBegin Downto 0 Begin
	sy=0;
	sx=0;
	sxy=0;
	sx2=0;
	For cnt=1 To ndot Begin
		sy+=close[shift+cnt-1];
		sx+=cnt;
		sx2+=cnt*cnt;
		sxy+=close[shift+cnt-1]*cnt;
	End;
	kb=(ndot*sxy-sx*sy)/(ndot*sx2-sx*sx);
	ka=(sy-kb*sx)/ndot;
	ival=ka+kb;
	SetIndexValue(shift, ival);
	loopBegin--;   // Prevent repeating previously plotted bars on next tick
End
*/
Sample
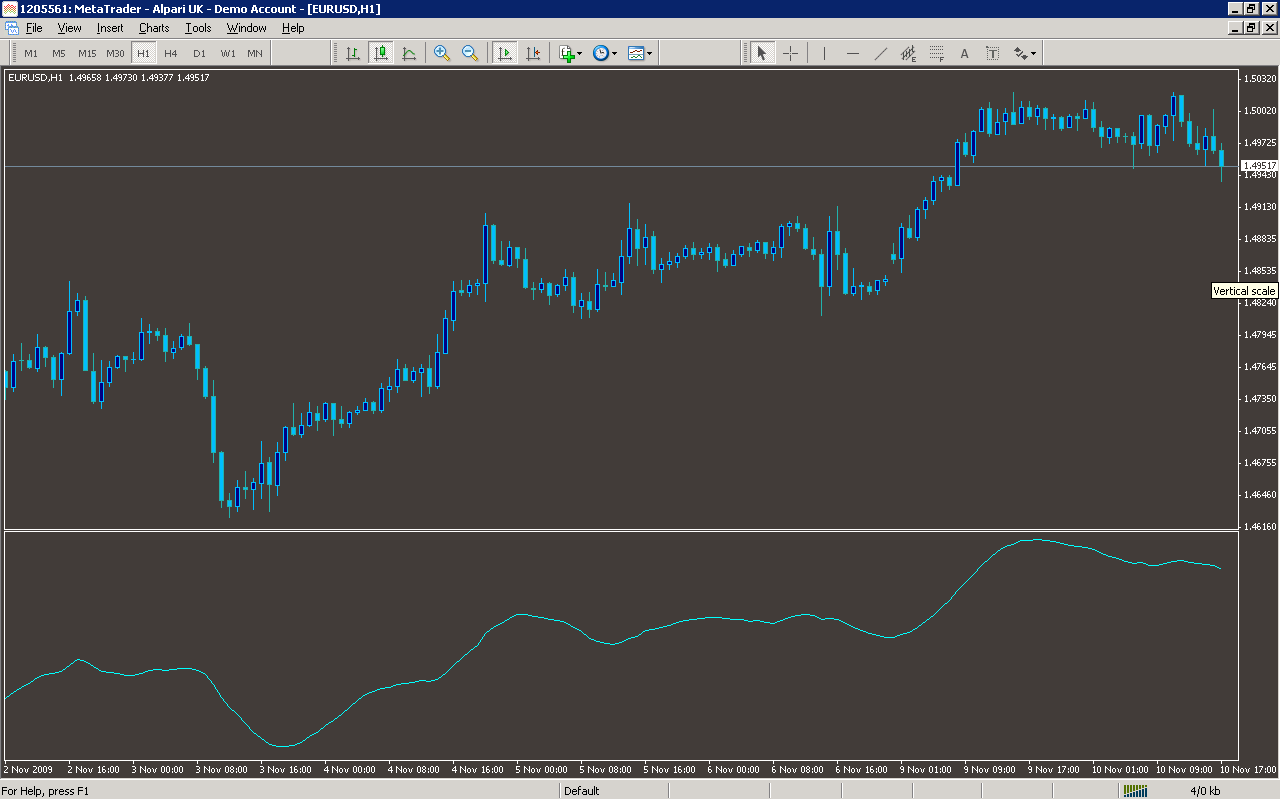
Analysis
Market Information Used:
Series array that contains close prices for each bar
Indicator Curves created:
Implements a curve of type DRAW_LINE
Indicators Used:
Custom Indicators Used:
Order Management characteristics:
Other Features: