//+------------------------------------------------------------------+
//|                                              TimeZone Pivots.mq4 |
//|                                 Copyright © 2005, Denis Manigart |
//|                                     mailto:emaildomino@gmail.com |
//+------------------------------------------------------------------+
#property copyright "Copyright © 2005, Denis Manigart"
#property link      "mailto:emaildomino@gmail.com"

#property indicator_chart_window
#property indicator_buffers 8

#property indicator_color1 Olive
#property indicator_color2 Red
#property indicator_color3 Blue
#property indicator_color4 Blue
#property indicator_color5 Red
#property indicator_color6 Olive
#property indicator_color7 Olive
#property indicator_color8 Red
//#property indicator_color4 Gray

//---- input parameters
extern int TimeZoneOfData=5; // by default if time zone of data is at GMT +5
                             // This gives you the Pivot calculations for 0 GMT

//---- buffers
double M0Array[];
double M1Array[];
double M2Array[];
double M3Array[];
double M4Array[];
double M5Array[];

double TodayOpenBuffer[];
double YesterdayCloseBuffer[];
double YesterdayHighBuffer[];
double YesterdayLowBuffer[];


//---- variables
int indexbegin = 0;
double todayopen = 0;
double yesterdayclose = 0;

double barhigh = 0;
double dayhigh = 0;
double yesterdayhigh = 0;

double barlow = 0;
double daylow = 0;
double yesterdaylow = 0;


//+------------------------------------------------------------------+
//| Custom indicator initialization function                         |
//+------------------------------------------------------------------+
int init()
{
//---- indicators

	// M0
SetIndexStyle(0,DRAW_LINE,2);
SetIndexBuffer(0,M0Array);
IndicatorShortName("TDmidPivot");
SetIndexLabel(0,"MO");
SetIndexEmptyValue(0, 0.0);
// M1
SetIndexStyle(1,DRAW_LINE,2);
SetIndexBuffer(1,M1Array);
SetIndexLabel(1,"M1");
SetIndexEmptyValue(1, 0.0);
// M2
SetIndexStyle(2,DRAW_LINE,2);
SetIndexBuffer(2,M2Array);
SetIndexLabel(2,"M2");
SetIndexEmptyValue(2, 0.0);
// M3
SetIndexStyle(3,DRAW_LINE,2);
SetIndexBuffer(3,M3Array);
SetIndexLabel(3,"M3");
SetIndexEmptyValue(3, 0.0);
// M4
SetIndexStyle(4,DRAW_LINE,2);
SetIndexBuffer(4,M4Array);
SetIndexLabel(4,"M4");
SetIndexEmptyValue(4, 0.0);
// M5
SetIndexStyle(5,DRAW_LINE,2);
SetIndexBuffer(5,M5Array);
SetIndexLabel(5,"M5");
SetIndexEmptyValue(5, 0.0);


// You may also display the previous day close - high - low

// Daily Close
//	SetIndexStyle(5, DRAW_LINE);
//	SetIndexBuffer(5, YesterdayCloseBuffer);
//	SetIndexLabel(5, "Daily Close");
//	SetIndexEmptyValue(5, 0.0);

// Daily High
//	SetIndexStyle(6, DRAW_LINE);
//	SetIndexBuffer(6, YesterdayHighBuffer);
//	SetIndexLabel(6, "YesterDay High");
//	SetIndexEmptyValue(6, 0.0);

// Daily Low
//	SetIndexStyle(7, DRAW_LINE);
//	SetIndexBuffer(7, YesterdayLowBuffer);
//	SetIndexLabel(7, "YesterDay Low");
//	SetIndexEmptyValue(7, 0.0);


//----
	indexbegin = Bars - 20;
	if (indexbegin < 0)
		indexbegin = 0;
return(0);
}

//+------------------------------------------------------------------+
//| Custor indicator deinitialization function                       |
//+------------------------------------------------------------------+
int deinit()
  {
//----

//----
   return(0);
 }
//+------------------------------------------------------------------+
//| Custom indicator iteration function                              |
//+------------------------------------------------------------------+
int start()
{
   int i;

	int counted_bars = IndicatorCounted();


double M0;
double M1;
double M2;
double M3;
double M4;
double M5;

	//---- check for possible errors
	if (counted_bars < 0) counted_bars = 0;
	//---- last counted bar will be recounted
	if (counted_bars > 0) counted_bars--;
	if (counted_bars > indexbegin) counted_bars = indexbegin;


		for (i = indexbegin-counted_bars; i >= 0; i--)
		{

		   if ( i == indexbegin-counted_bars)
		       {
		        dayhigh = High[i];
		        daylow = Low[i];
		       }

		       barlow = Low[i];
				 barhigh = High[i];

			if ( barhigh >= dayhigh)
			    dayhigh = barhigh;

			if ( barlow <= daylow)
			    daylow = barlow;

//Cycle through all the bars and fill the indicator bars with the Pivot point values

			if ((TimeMinute(Time[i]) == 00) && (TimeHour(Time[i]) - TimeZoneOfData == 00))
				{todayopen = Open[i];
				 yesterdayclose = Close[i+1];
				 yesterdaylow = daylow;
				 daylow = Low [i]; // input new day value

				 yesterdayhigh = dayhigh;
				 dayhigh = High [i]; // input new day value

				M0 = (3*yesterdaylow-2*yesterdayhigh+yesterdayclose)/2;
				M1 = (2*yesterdaylow-yesterdayhigh+yesterdayclose)/2;
				M2 = (yesterdaylow+yesterdayclose)/2;
				M3 = (yesterdayhigh+yesterdayclose)/2;
				M4 = (2*yesterdayhigh-yesterdaylow+yesterdayclose)/2;
				M5 = (3*yesterdayhigh-2*yesterdaylow+yesterdayclose)/2;


				 }

				//These can be used for any calculations
				TodayOpenBuffer[i] = todayopen;
				YesterdayCloseBuffer[i] = yesterdayclose;
				YesterdayHighBuffer[i] = yesterdayhigh;
				YesterdayLowBuffer[i] = yesterdaylow;


			   M0Array[i]=M0;
            M1Array[i]=M1;
            M2Array[i]=M2;
            M3Array[i]=M3;
            M4Array[i]=M4;
            M5Array[i]=M5;


	}


	return(0);
}
//+------------------------------------------------------------------+
Sample
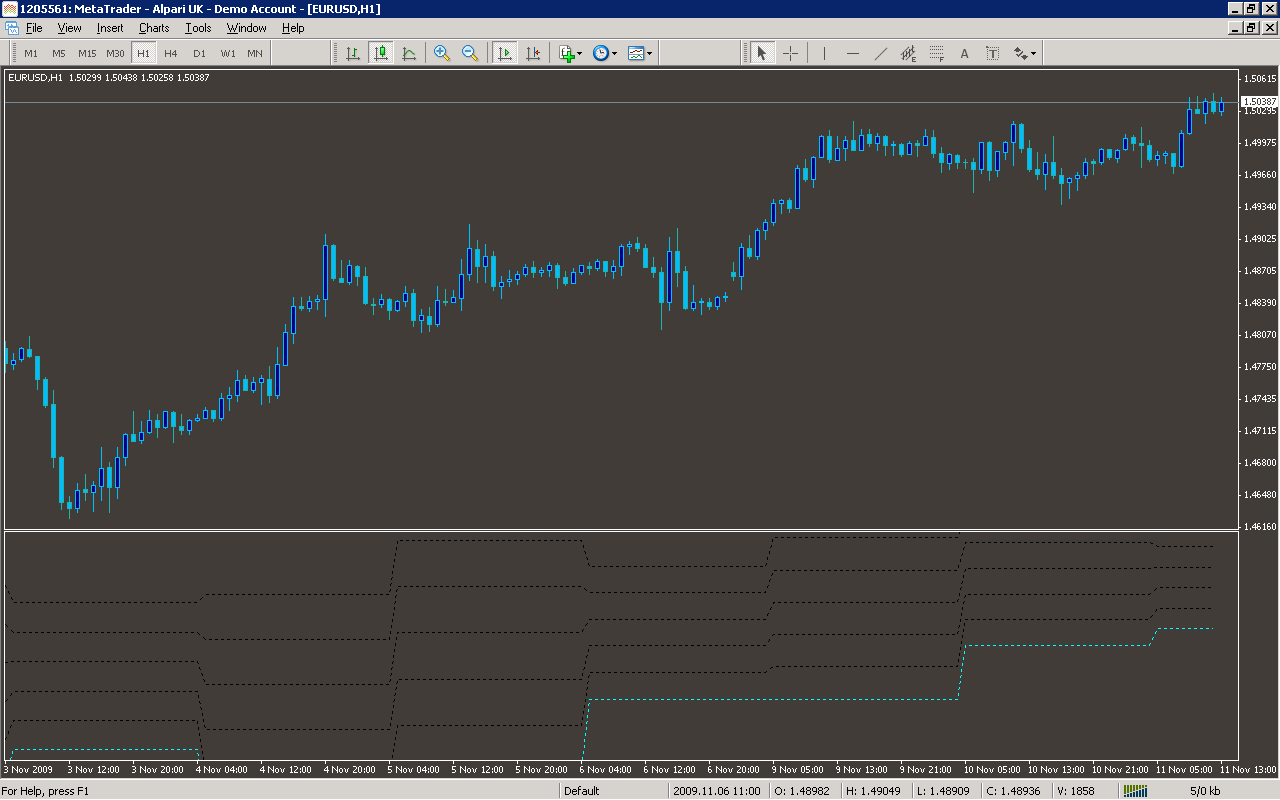
Analysis
Market Information Used:
Series array that contains the highest prices of each bar
Series array that contains the lowest prices of each bar
Series array that contains open time of each bar
Series array that contains open prices of each bar
Series array that contains close prices for each bar
Indicator Curves created:
Implements a curve of type DRAW_LINE
Indicators Used:
Custom Indicators Used:
Order Management characteristics:
Other Features: