// Trend Manager Open2 separate window.mq4
//
// Look & Feel of original based on indicator sold at traderstradingsystem.com
// this one plots in lower histogram window.

// No representation it is identical.
// This file is licensed under the terms of the GNU General Public License V2.
//
// (c) 2006 Matt Kennel (mbkennel@gmail.com)

#property indicator_separate_window
#property indicator_buffers 2
#property indicator_color1 Red
#property indicator_color2 Blue


extern int TM_Period_1 = 7;
extern int TM_Shift_1 = 2;
extern int TM_Period_2 = 13; // Put TM_Period_2 params equal to first to get orig TrendManager system
extern int TM_Shift_2 = 1;

int Max_Period;
int Max_Shift;

double Up_Histogram[];
double Down_Histogram[];

int a_begin;

int init()
{
   Max_Shift = MathMax(TM_Shift_1,TM_Shift_2);
   Max_Period = MathMax(TM_Period_1,TM_Period_2);

   int b_begin = Max_Period+Max_Shift-1;

   SetIndexStyle(1,DRAW_HISTOGRAM,STYLE_SOLID);
   SetIndexBuffer(1,Down_Histogram);
   SetIndexDrawBegin(1,b_begin);
   SetIndexLabel(1,"TM_Period+");

   SetIndexStyle(0,DRAW_HISTOGRAM,STYLE_SOLID);
   SetIndexBuffer(0,Up_Histogram);
   SetIndexDrawBegin(0,b_begin);
   SetIndexLabel(0,"TM_Period");

   return(0);
}

int start()
{
   int    i,k;
   int    counted_bars=IndicatorCounted();
   double high,low,price;

   if(Bars<=Max_Period) return(0);

   i=Bars-Max_Period;
   if(counted_bars>Max_Period) i=Bars-counted_bars-1;
   while(i>=0)
   {

      double M1, M1b;
      double M2, M2b;

      M1 = MiddlePrice(TM_Period_1,i);
      M1b = MiddlePrice(TM_Period_1,i+TM_Shift_1);
      M2 = MiddlePrice(TM_Period_2,i);
      M2b = MiddlePrice(TM_Period_2,i+TM_Shift_2);

      //
      double diff1 = (M1-M1b); // up or down on short term;
      double diff2 = (M2-M2b); // up or down on longer term.
      // each has three choices, hence six possibilities.


      if (diff1*diff2 <= 0.0) { // opposite signs
         Down_Histogram[i] = 0.0;
         Up_Histogram[i] = 0.0;
      } else {
         double diff = 0.5* (M1+M2 - M1b-M2b);
         if (diff >= 0) {
            Up_Histogram[i]=diff;
            Down_Histogram[i]=0.0;
         } else {
            Up_Histogram[i] = 0.0;
            Down_Histogram[i]=diff;
         }
      }


      i--;
   }

   return(0);
}

double MiddlePrice(int nback, int shift) {
  double H = High[Highest(NULL,0,MODE_HIGH,nback,shift)];
  double L = Low[Lowest(NULL,0,MODE_LOW,nback,shift)];
  return( 0.5*(H+L));

}
Sample
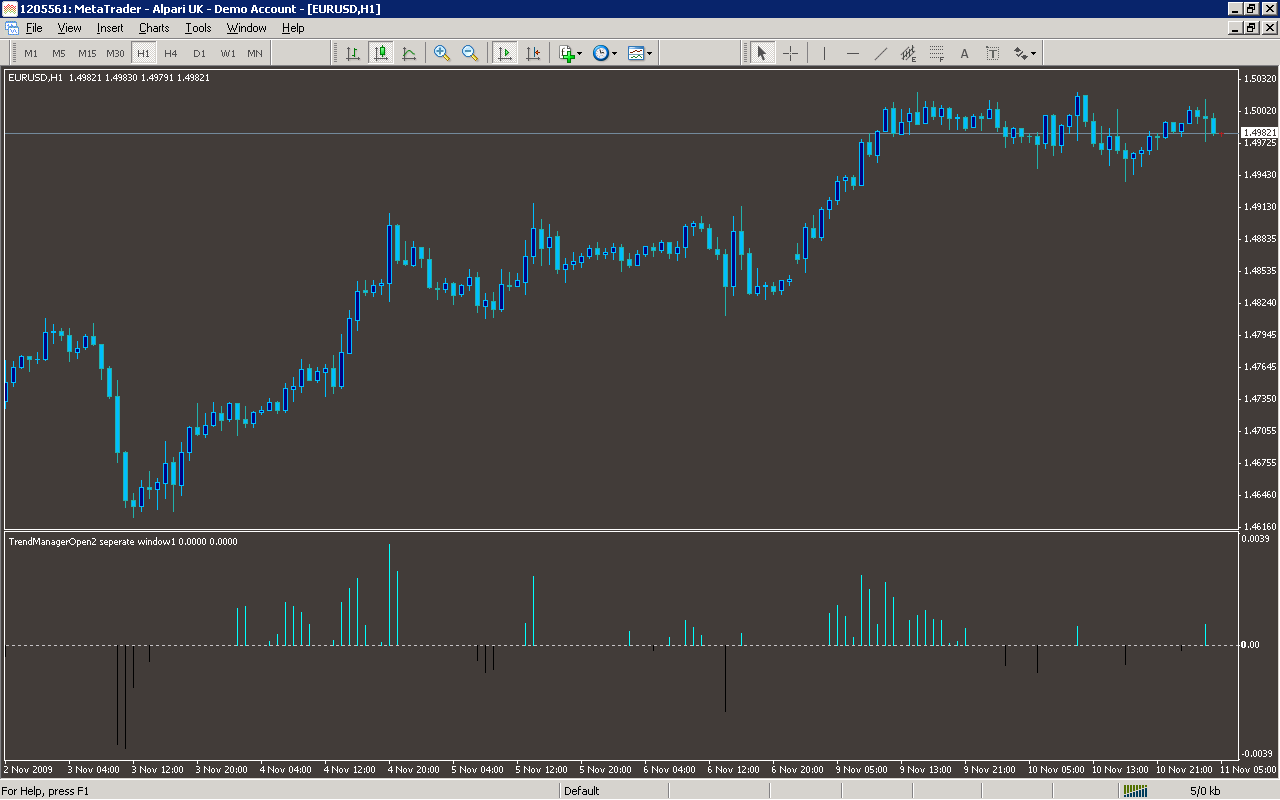
Analysis
Market Information Used:
Series array that contains the highest prices of each bar
Series array that contains the lowest prices of each bar
Indicator Curves created:
Implements a curve of type DRAW_HISTOGRAM
Indicators Used:
Custom Indicators Used:
Order Management characteristics:
Other Features: