//+------------------------------------------------------------------+
//|                                                       TRSI       |
//|                                    Copyright © 2007, Robert Hill |
//|                                       http://www.metaquotes.net/ |
//|                                                                  |
//| This is the formula from Mario:
//|
//| 1) RSI 14 period of close. Plot this as the gray line
//|
//| 2) 3-period exponential moving average of #1 above.
//|
//| 3) 3-period exponential moving average of #2 above.
//|
//| 4) 3-period exponential moving average of #3 above.
//|    Plot this as the blue line.
//|
//| 5) 5-period simple moving average of #4 above
//|    displaced 3 bars to the right.
//|    Plot this as the red line.
//|                                                                  |
//+------------------------------------------------------------------+
#property  copyright "Copyright © 2006, Robert Hill "
#property  link      "http://www.metaquotes.net/"

//---- indicator settings
#property  indicator_separate_window
#property  indicator_buffers 3
#property  indicator_color1  Gray
#property  indicator_color2  Blue
#property  indicator_color3  Red
#property  indicator_width1  1
#property  indicator_width2  1
#property  indicator_width3  1

extern int RSI_Period = 14;

//---- buffers
double RSI[];
double EmaOfRSI[];
double EmaOfEmaOfRSI[];
double EmaOfEmaOfEmaOfRSI[];
double TRSI[];


//+------------------------------------------------------------------+
//| Custom indicator initialization function                         |
//+------------------------------------------------------------------+
int init()
  {

//---- drawing settings
   IndicatorBuffers(5);
   SetIndexStyle(0,DRAW_LINE);
   SetIndexStyle(1,DRAW_LINE);
   SetIndexStyle(2,DRAW_LINE);
   SetIndexDrawBegin(0,RSI_Period);
   IndicatorDigits(MarketInfo(Symbol(),MODE_DIGITS)+2);

//---- 3 indicator buffers mapping
   if(!SetIndexBuffer(0,RSI) &&
      !SetIndexBuffer(1,EmaOfEmaOfEmaOfRSI) &&
      !SetIndexBuffer(2,TRSI)
      !SetIndexBuffer(3,EmaOfRSI)
      !SetIndexBuffer(4,EmaOfEmaOfRSI))
      Print("cannot set indicator buffers!");
//---- name for DataWindow and indicator subwindow label
   SetIndexLabel(0,"RSI");
   SetIndexLabel(1,"TripleEmaOfRSI");
   SetIndexLabel(2,"TRSI");
   IndicatorShortName("TRSI("+RSI_Period+")");
//---- initialization done
   return(0);
  }

int start()
{
   int i, limit;
   int    counted_bars=IndicatorCounted();
   if(counted_bars>0) counted_bars--;
   limit=Bars-counted_bars - RSI_Period;


// 1) RSI 14 period of close. Plot this as the gray line
   for(i = limit; i >= 0; i--)
       RSI[i] = iRSI(NULL,0,RSI_Period,PRICE_CLOSE,i);

// 2) 3-period exponential moving average of #1 above.
   for(i = limit; i >=0; i--)
       EmaOfRSI[i] = iMAOnArray(RSI,Bars,3,0,MODE_EMA,i);

// 3) 3-period exponential moving average of #2 above.
   for(i = limit; i >=0; i--)
       EmaOfEmaOfRSI[i] = iMAOnArray(EmaOfRSI,Bars,3,0,MODE_EMA,i);

// 4) 3-period exponential moving average of #3 above.
   for(i = limit; i >=0; i--)
       EmaOfEmaOfEmaOfRSI[i] = iMAOnArray(EmaOfEmaOfRSI,Bars,3,0,MODE_EMA,i);

//========== COLOR CODING ===========================================

// 5) 5-period simple moving average of #4 above
//    displaced 3 bars to the right.
   for(i = limit; i >=0; i--)
   {
       TRSI[i] = iMAOnArray(EmaOfEmaOfEmaOfRSI,Bars,5,3,MODE_SMA,i);
   }

      return(0);
  }
//+------------------------------------------------------------------+
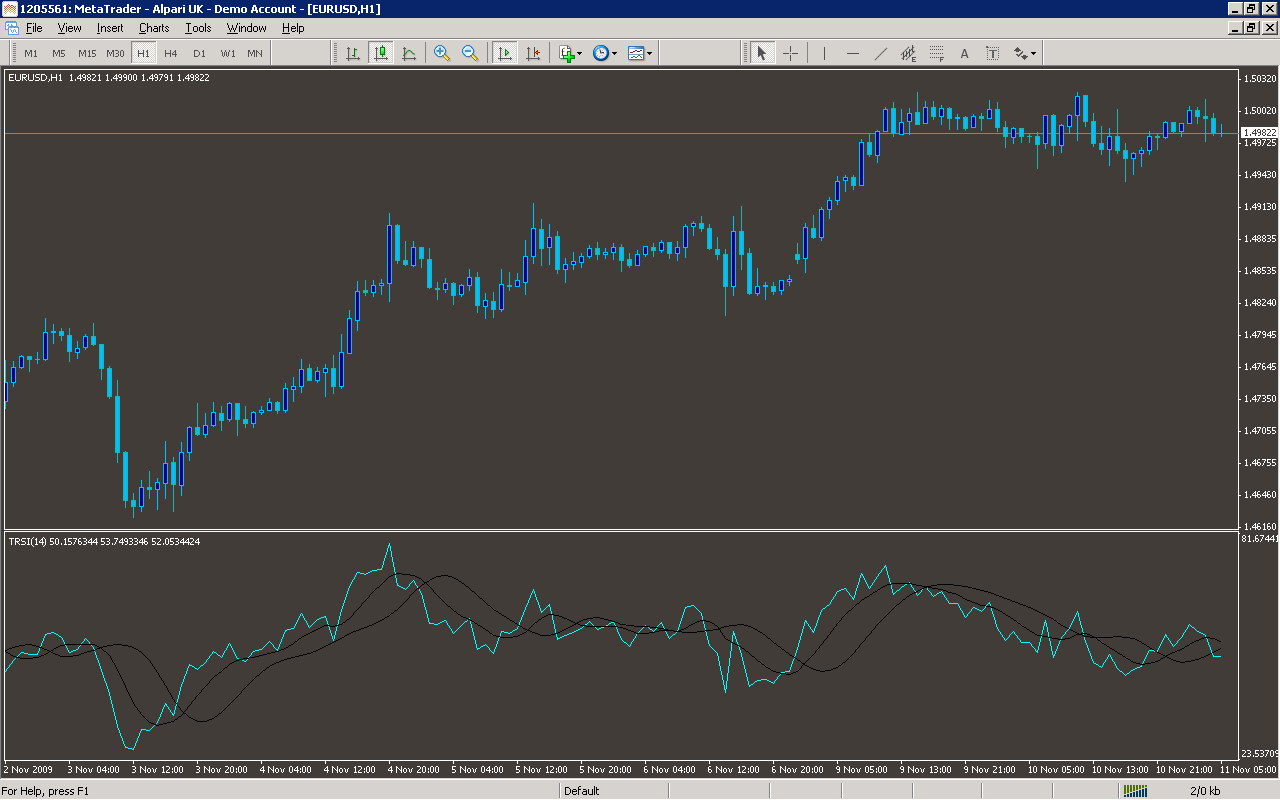
Sample
Analysis
Market Information Used:
Indicator Curves created:
Implements a curve of type DRAW_LINE
Indicators Used:
Relative strength index
Moving average indicator
Custom Indicators Used:
Order Management characteristics:
Other Features: