//+------------------------------------------------------------------+
//| TRSI |
//| Copyright © 2007, Robert Hill |
//| http://www.metaquotes.net/ |
//| |
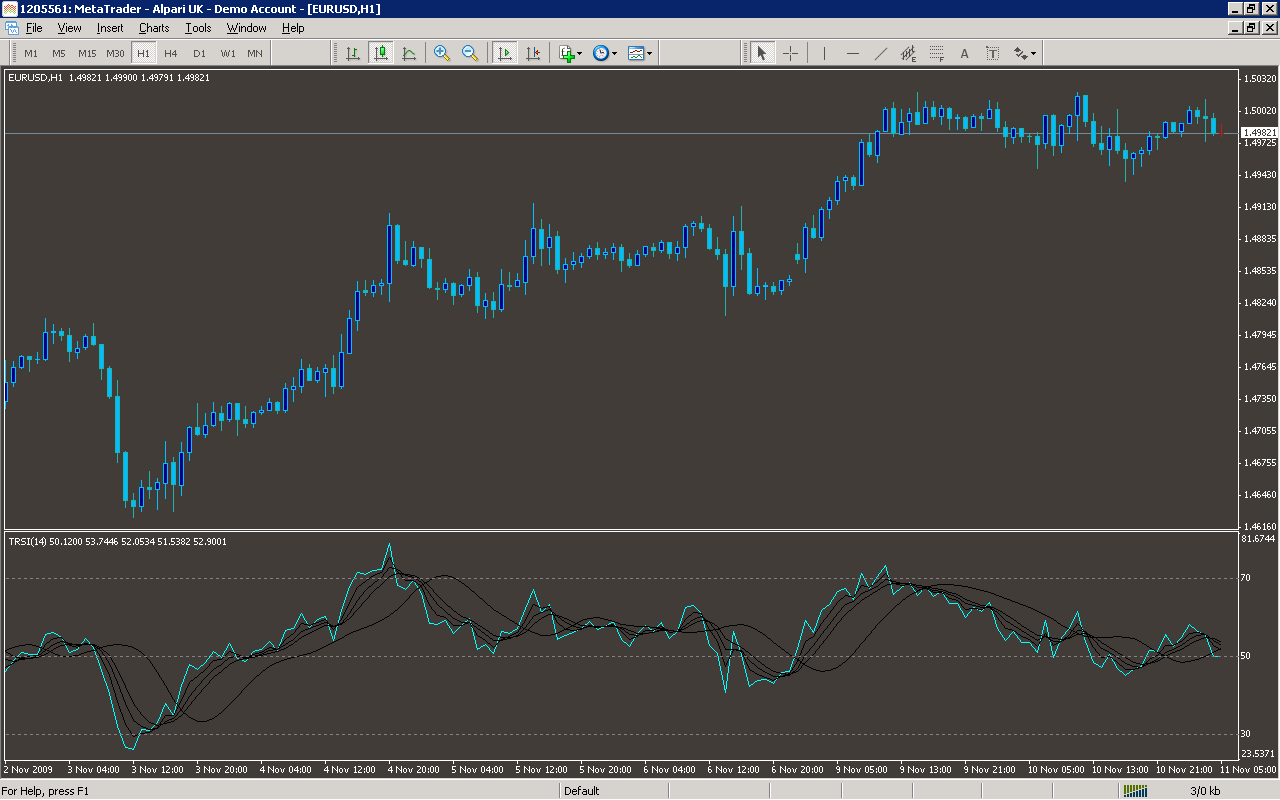
//| This is the formula from Mario:
//|
//| 1) RSI 14 period of close. Plot this as the gray line
//|
//| 2) 3-period exponential moving average of #1 above.
//|
//| 3) 3-period exponential moving average of #2 above.
//|
//| 4) 3-period exponential moving average of #3 above.
//| Plot this as the blue line.
//|
//| 5) 5-period simple moving average of #4 above
//| displaced 3 bars to the right.
//| Plot this as the red line.
//| |
//+------------------------------------------------------------------+
#property copyright "Copyright © 2006, Robert Hill "
#property link "http://www.metaquotes.net/"
//---- indicator settings
#property indicator_separate_window
#property indicator_buffers 5
#property indicator_color1 Gray
#property indicator_color2 Aqua
#property indicator_color3 Red
#property indicator_color4 Yellow
#property indicator_color5 White
#property indicator_width1 1
#property indicator_width2 1
#property indicator_width3 1
#property indicator_width4 1
#property indicator_width5 1
extern string r1=" 1. RSI(14) of Close";
extern string r2=" 2. EMA(3) of #1";
extern string r3=" 3. EMA(3) of #2";
extern string r4=" 4. EMA(3) of #3";
extern string r5=" 5. SMA(5) of #4";
extern string r6=" shifted right 3 bars";
extern int RSI_Period = 14;
extern string p = "--Applied Price Types--";
extern string p0 = " 0 = close";
extern string p1 = " 1 = open";
extern string p2 = " 2 = high";
extern string p3 = " 3 = low";
extern string p4 = " 4 = median(high+low)/2";
extern string p5 = " 5 = typical(high+low+close)/3";
extern string p6 = " 6 = weighted(high+low+close+close)/4";
extern int RSI_AppliedPrice = 0;//0=close, 1=open, 2=high, 3=low, 4=median(high+low)/2, 5=typical(high+low+close)/3, 6=weighted(high+low+close+close)/4
extern int EMA1_Period = 3;
extern int EMA2_Period = 3;
extern int EMA3_Period = 3;
extern int SMA_Period = 5;
extern int SMA_Shift = 3;
extern bool PlotEMA1 = true;
extern bool PlotEMA2 = true;
//---- buffers
double RSI[];
double EmaOfRSI[];
double EmaOfEmaOfRSI[];
double EmaOfEmaOfEmaOfRSI[];
double TRSI[];
double TempEma1RSI[];
double TempEma2RSI[];
//+------------------------------------------------------------------+
//| Custom indicator initialization function |
//+------------------------------------------------------------------+
int init()
{
//---- drawing settings
IndicatorBuffers(7);
SetIndexStyle(0,DRAW_LINE);
SetIndexStyle(1,DRAW_LINE);
SetIndexStyle(2,DRAW_LINE);
SetIndexDrawBegin(0,RSI_Period);
IndicatorDigits(4);
//---- 3 indicator buffers mapping
if(!SetIndexBuffer(0,RSI) &&
!SetIndexBuffer(1,EmaOfEmaOfEmaOfRSI) &&
!SetIndexBuffer(2,TRSI) &&
!SetIndexBuffer(3,EmaOfRSI) &&
!SetIndexBuffer(4,EmaOfEmaOfRSI) &&
!SetIndexBuffer(5,TempEma1RSI) &&
!SetIndexBuffer(6,TempEma2RSI))
Print("cannot set indicator buffers!");
//---- name for DataWindow and indicator subwindow label
SetIndexLabel(0,"RSI");
SetIndexLabel(1,"TripleEmaOfRSI");
SetIndexLabel(2,"TRSI");
SetIndexLabel(3,"EmaOfRSI");
SetIndexLabel(4,"DoubelEmaOfRSI");
SetLevelStyle(STYLE_DOT, 1, Gray);
SetLevelValue(0, 30);
SetLevelValue(1, 50);
SetLevelValue(2, 70);
IndicatorShortName("TRSI("+RSI_Period+")");
//---- initialization done
return(0);
}
int start()
{
int i, limit;
int counted_bars=IndicatorCounted();
if(counted_bars>0) counted_bars--;
// limit=Bars-counted_bars - RSI_Period;
limit=Bars-counted_bars;
// 1) RSI 14 period of close. Plot this as the gray line
// for(i = limit; i >= 0; i--)
for(i=0; i<limit; i++)
RSI[i] = iRSI(NULL,0,RSI_Period,RSI_AppliedPrice,i);
// 2) 3-period exponential moving average of #1 above.
// for(i = limit; i >=0; i--)
for(i=0; i<limit; i++)
TempEma1RSI[i] = iMAOnArray(RSI,Bars,EMA1_Period,0,MODE_EMA,i);
// 3) 3-period exponential moving average of #2 above.
// for(i = limit; i >=0; i--)
for(i=0; i<limit; i++)
TempEma2RSI[i] = iMAOnArray(TempEma1RSI,Bars,EMA2_Period,0,MODE_EMA,i);
// 4) 3-period exponential moving average of #3 above.
// for(i = limit; i >=0; i--)
for(i=0; i<limit; i++)
EmaOfEmaOfEmaOfRSI[i] = iMAOnArray(TempEma2RSI,Bars,EMA3_Period,0,MODE_EMA,i);
//========== COLOR CODING ===========================================
// 5) 5-period simple moving average of #4 above
// displaced 3 bars to the right.
for(i = limit; i >=0; i--)
{
if (PlotEMA1) EmaOfRSI[i] = TempEma1RSI[i]; else EmaOfRSI[i] = EMPTY_VALUE;
if (PlotEMA2) EmaOfEmaOfRSI[i] = TempEma2RSI[i]; else EmaOfEmaOfRSI[i] = EMPTY_VALUE;
TRSI[i] = iMAOnArray(EmaOfEmaOfEmaOfRSI,Bars,SMA_Period,SMA_Shift,MODE_SMA,i);
}
return(0);
}
//+------------------------------------------------------------------+
Sample
Analysis
Market Information Used:
Indicator Curves created:
Implements a curve of type DRAW_LINE
Indicators Used:
Relative strength index
Moving average indicator
Custom Indicators Used:
Order Management characteristics:
Other Features: