//+------------------------------------------------------------------+
//|                                                                  |                                                 VQ.mq4 |
//|                                               Volatility Quality |
//|                                                by raff1410@o2.pl |
//+------------------------------------------------------------------+

#property  indicator_chart_window
#property  indicator_buffers 2
#property  indicator_color1  Green
#property  indicator_color2  Red
#property  indicator_width1  2
#property  indicator_width2  2

extern   int      Length = 5;
extern   int      Method = 3;
extern   int      Smoothing = 1;
extern   int      Filter = 5;
extern   bool     Steady  = false;

double   VQ[];
double   SumVQ[];
double   DIR[];
double   UpBuffer[];
double   DnBuffer[];

//+------------------------------------------------------------------+

int init()
{
IndicatorBuffers(5);
SetIndexStyle(0,DRAW_HISTOGRAM);
SetIndexBuffer(0,UpBuffer);
SetIndexStyle(1,DRAW_HISTOGRAM);
SetIndexBuffer(1,DnBuffer);
SetIndexBuffer(2,SumVQ);
SetIndexBuffer(3,VQ);
SetIndexBuffer(4,DIR);

if (Length < 2) Length = 2;
if (Method < 0) Method = 0;
if (Method > 3) Method = 3;
if (Smoothing < 0) Smoothing = 0;
if (Filter < 0) Filter = 0;

string short_name = "VQ | "+ Length + " , " +
Method + " , " + Smoothing + " , " + Filter + "  | ";
IndicatorShortName(short_name);
SetIndexEmptyValue(0, 0.0);
SetIndexEmptyValue(1, 0.0);
SetIndexEmptyValue(2, 0.0);
SetIndexEmptyValue(3, 0.0);
return(0);
}

//+------------------------------------------------------------------+

int start()
{
 double MH = 0, ML = 0, MO = 0, MC = 0, MC1 = 0;
 int i, j, limit, counted_bars=IndicatorCounted();
//---- check for possible errors
 if(counted_bars<0) return(-1);
//---- last counted bar will be recounted
 if(counted_bars>0) counted_bars--;
//----
 if(counted_bars<1) i=Bars-Length-1;
 else i=Bars-counted_bars;
 if(counted_bars<1)
  {
   j=Bars-Length-1;
   SumVQ[j + 1] = Close[j + 1];
  }
 while (i >= 0)
   {
    MH = iMA(NULL,0,Length,0,Method,PRICE_HIGH,i);
    ML = iMA(NULL,0,Length,0,Method,PRICE_LOW,i);
    MO = iMA(NULL,0,Length,0,Method,PRICE_OPEN,i);
    MC = iMA(NULL,0,Length,0,Method,PRICE_CLOSE,i);
    MC1 = iMA(NULL,0,Length,0,Method,PRICE_CLOSE,i+Smoothing);

    if (Steady==true)
     {
      MC=iMA(NULL,0,Length,0,Method,PRICE_MEDIAN,i);
      MC1=iMA(NULL,0,Length,0,Method,PRICE_MEDIAN,i+Smoothing);
     }

    if((MH - ML)>0) VQ[i] = MathAbs(((MC - MC1) / MathMax(MH - ML, MathMax(MH - MC1, MC1 - ML)) + (MC - MO) / (MH - ML)) * 0.5) * ((MC - MC1 + (MC - MO)) * 0.5);
    SumVQ[i] = SumVQ[i + 1] + VQ[i];
    if (Filter > 0) if (MathAbs(SumVQ[i] - SumVQ[i + 1]) < Filter * Point) SumVQ[i] = SumVQ[i + 1];
    i--;
   }
 if(counted_bars<1) limit=Bars-Length-1;
 else limit=Bars-counted_bars;
 for (i = limit-1; i >= 0; i--)
  {
   if (SumVQ[i] > SumVQ[i+1]) DIR[i] = 1;
   if (SumVQ[i] < SumVQ[i+1]) DIR[i] = -1;
   if (SumVQ[i]== SumVQ[i+1]) DIR[i] = DIR[i + 1];

   if (DIR[i] > 0)
    {
     UpBuffer[i] = High[i];

     DnBuffer[i] = Low[i];
    }
   else
   if (DIR[i] < 0)
    {
     DnBuffer[i] = High[i];

     UpBuffer[i] = Low[i];
    }
  }

return(0);
}
Sample
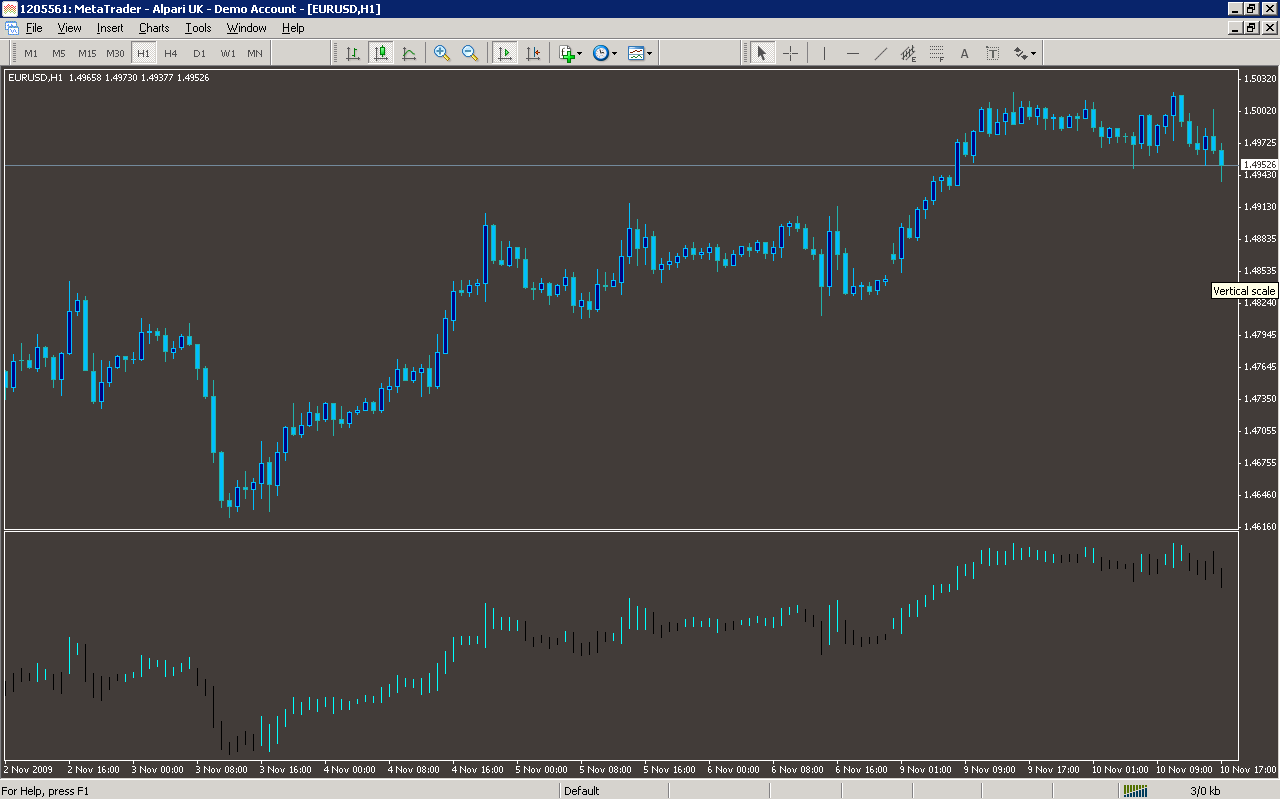
Analysis
Market Information Used:
Series array that contains close prices for each bar
Series array that contains the highest prices of each bar
Series array that contains the lowest prices of each bar
Indicator Curves created:
Implements a curve of type DRAW_HISTOGRAM
Indicators Used:
Moving average indicator
Custom Indicators Used:
Order Management characteristics:
Other Features: