//+------------------------------------------------------------------+
//|                                                      XPoints.mq4 |
//|                               Copyright © 2007, RedPlumSoft, Inc |
//|                                       http://www.redplumsoft.com |
//+------------------------------------------------------------------+
#property copyright "Copyright © 2007, RedPlumSoft, Inc"
#property link      "http://www.redplumsoft.com"

//---- indicator props
#define Buffer_Count 5
#define Buffer_Lines 5

#property indicator_chart_window
#property indicator_buffers Buffer_Lines

#property indicator_color1 Blue
#property indicator_color2 Red
#property indicator_color3 Blue
#property indicator_color4 Red
#property indicator_color5 Yellow

//---- Âõîäíûå ïàðàìåòðû
extern int per=3;
extern double xrate=1.5;
extern double xsize=5.0;
extern double xslope=0.0;
extern double xminupdn=10.0;

extern int xhour1=9;
extern int xhour2=19;
extern int xindent=15;

double BfXB[],BfXS[];
double BufD[],BufU[],BufM[];

//+------------------------------------------------------------------+
//| Custom indicator initialization function                         |
//+------------------------------------------------------------------+
int init()
  {
   int j=0;

   IndicatorBuffers(Buffer_Count);
   IndicatorShortName("XPoints");

   SetIndexBuffer(j,BfXB);    SetIndexStyle(j,DRAW_ARROW,0,1);  SetIndexLabel(j,"X up");  SetIndexArrow(j,233);  SetIndexEmptyValue(j, 0.0); j++;
   SetIndexBuffer(j,BfXS);    SetIndexStyle(j,DRAW_ARROW,0,1);  SetIndexLabel(j,"X dn");  SetIndexArrow(j,234);  SetIndexEmptyValue(j, 0.0); j++;

   SetIndexBuffer(j,BufD);    SetIndexStyle(j,DRAW_LINE,2);     SetIndexLabel(j,"Lower");    j++;
   SetIndexBuffer(j,BufU);    SetIndexStyle(j,DRAW_LINE,2);     SetIndexLabel(j,"Upper");    j++;
   SetIndexBuffer(j,BufM);    SetIndexStyle(j,DRAW_LINE,2);     SetIndexLabel(j,"Middle");   j++;

   return(0);
  }

//+------------------------------------------------------------------+
//| Custom indicator start function                                  |
//+------------------------------------------------------------------+
int start()
  {
   int SH,CB=IndicatorCounted(),limit;

   if(CB<0) return(-1);

   limit = Bars-CB;

   if(CB>0)
      limit++;
   else
     {
      ArrayInitialize(BfXB,0.0);
      ArrayInitialize(BfXS,0.0);
      ArrayInitialize(BufD,0.0);
      ArrayInitialize(BufU,0.0);
      ArrayInitialize(BufM,0.0);
     }

   // check params

   if(xrate<1) xrate=1;
   if(xsize<3) xsize=3;
   if(xindent<3) xindent=3;

   if(xhour1<0) xhour1=0;
   if(xhour1>23) xhour1=23;
   if(xhour2<=xhour1) xhour2=xhour1+1;
   if(xhour2==0) xhour2=24;

   // indicator

   double MaxP,MinP,ArrowB,ArrowS;
   double xrate0,xrate1;

   double HeightHL0,HeightHL1,HeightCO0,HeightCO1,HeightUD;
   double CenterHL0,CenterHL1,CenterCO0,CenterCO1;

   int th;

   //double CurWPR;

   for(SH=limit-1; SH>=0; SH--)
     {
      BfXB[SH] = 0.0;
      BfXS[SH] = 0.0;

      MinP = Low[iLowest(NULL,0,MODE_LOW,per,SH)];
      MaxP = High[iHighest(NULL,0,MODE_HIGH,per,SH)];

      BufD[SH] = MinP;
      BufU[SH] = MaxP;
      BufM[SH] = (MinP+MaxP)/2;

      HeightUD = (MaxP-MinP)/Point;
      if(HeightUD < xminupdn) continue;

      // check time

      th = TimeHour(iTime(NULL, 0, SH));
      if(th < xhour1 || th > xhour2) continue;

      // arrow positions

      ArrowB = Low[SH] - xindent*Point;
      ArrowS = High[SH] + xindent*Point;

      // signal measurements

      HeightHL0 = (High[SH+0]-Low[SH+0])/Point;
      HeightHL1 = (High[SH+1]-Low[SH+1])/Point;

      HeightCO0 = (Close[SH+0]-Open[SH+0])/Point;
      HeightCO1 = (Close[SH+1]-Open[SH+1])/Point;

      CenterHL0 = (High[SH+0]+Low[SH+0])/2;
      CenterHL1 = (High[SH+1]+Low[SH+1])/2;

      CenterCO0 = (Open[SH+0]+Close[SH+0])/2;
      CenterCO1 = (Open[SH+1]+Close[SH+1])/2;

      // check if X-point

      if(HeightHL1 < xsize) continue;

      xrate1 = HeightCO1/HeightHL1;
      if(MathAbs(xrate1) > 1/xrate) continue;

      // check if there is a trend

      if(true
         && Low[SH+1]  <= BufD[SH+1]
         && High[SH+1] <  BufU[SH+1]
         && Low[SH+0]  >= Low[SH+1] + xslope*Point

         && (CenterCO1  <= BufM[SH+1]
             || CenterCO0 >= CenterCO1 + xslope*Point
             || CenterHL0 >= CenterHL1 + xslope*Point)
         )
         BfXB[SH] = ArrowB;

      if(true
         && High[SH+1] >= BufU[SH+1]
         && Low[SH+1]  >  BufD[SH+1]
         && High[SH+0] <= High[SH+1] - xslope*Point

         && (CenterCO1  >= BufM[SH+1]
             || CenterCO0 <= CenterCO1 - xslope*Point
             || CenterHL0 <= CenterHL1 - xslope*Point)
         )
         BfXS[SH] = ArrowS;
     }

   return(0);
  }
//+------------------------------------------------------------------+
Sample
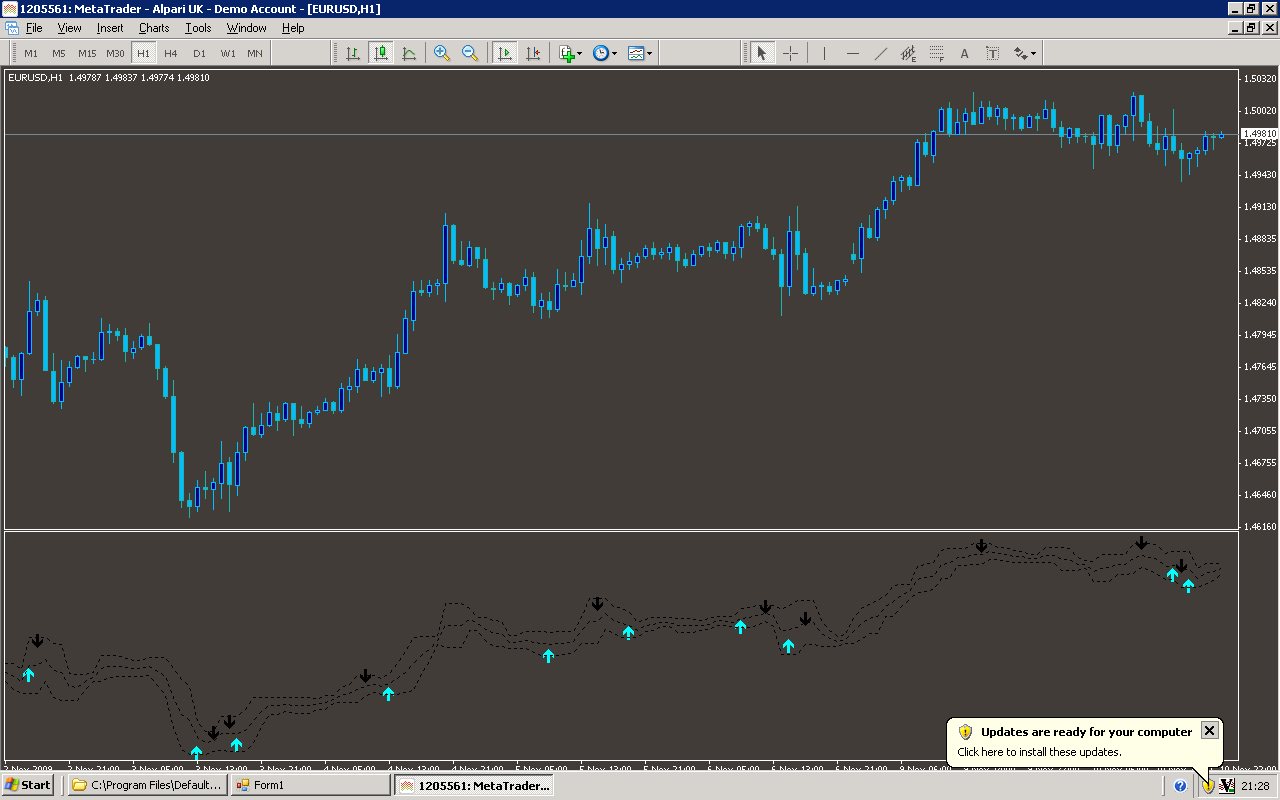
Analysis
Market Information Used:
Series array that contains the lowest prices of each bar
Series array that contains the highest prices of each bar
Series array that contains close prices for each bar
Series array that contains open prices of each bar
Indicator Curves created:
Implements a curve of type DRAW_ARROW
Implements a curve of type DRAW_LINE
Indicators Used:
Custom Indicators Used:
Order Management characteristics:
Other Features: