//+------------------------------------------------------------------+
//|                                                  ZZ MTF XO A.mq4 |
//|                                                                  |
//+------------------------------------------------------------------+
#property copyright " ZZ MTF XO A "
#property link      " ZZ MTF XO A "

#property indicator_separate_window
#property indicator_buffers 4
#property indicator_color1 DarkGoldenrod
#property indicator_color2 DarkGreen
#property indicator_color3 LimeGreen
#property indicator_color4 Gold

#property indicator_maximum 4
#property indicator_minimum -4

extern double KirPER=7;                            //10
//---- input parameters
/*************************************************************************
PERIOD_M1   1
PERIOD_M5   5
PERIOD_M15  15
PERIOD_M30  30
PERIOD_H1   60
PERIOD_H4   240
PERIOD_D1   1440
PERIOD_W1   10080
PERIOD_MN1  43200
You must use the numeric value of the timeframe that you want to use
when you set the TimeFrame' value with the indicator inputs.
**************************************************************************/
//---- buffers

double ExtMapBuffer1[];
double ExtMapBuffer2[];
double ExtMapBuffer3[];
double ExtMapBuffer4[];


//+------------------------------------------------------------------+
//| Custom indicator initialization function                         |
//+------------------------------------------------------------------+
int init()
  {

//---- indicators
   SetIndexStyle(0,DRAW_HISTOGRAM,EMPTY,2);
   SetIndexBuffer(0,ExtMapBuffer1);
   SetIndexStyle(1,DRAW_HISTOGRAM,EMPTY,2);
   SetIndexBuffer(1,ExtMapBuffer2);
   SetIndexStyle(2,DRAW_HISTOGRAM,EMPTY,2);
   SetIndexBuffer(2,ExtMapBuffer3);
   SetIndexStyle(3,DRAW_HISTOGRAM,EMPTY,2);
   SetIndexBuffer(3,ExtMapBuffer4);


   string short_name;
   short_name=("4 TF XO("+KirPER+")");
    IndicatorShortName(short_name);
     SetIndexLabel(0,short_name);
  }
//----
   return(0);

//+------------------------------------------------------------------+
//| MTF Parabolic Sar                                         |
//+------------------------------------------------------------------+
int start()
  {
   int    i,limit,y=0,counted_bars=IndicatorCounted();

   limit=Bars-counted_bars;
   limit=Bars-counted_bars;
   int lastp15=0, lastp30=0, lastp60=0;
   for(i=0,y=0;i<limit;i++)
   {
      int p5,p15,p30,p60;

      p5 = i;
      p15 = iBarShift( NULL, PERIOD_M15, Time[i], false );
      p30 = iBarShift( NULL, PERIOD_M30, Time[i], false );
      p60 = iBarShift( NULL, PERIOD_H1, Time[i], false );

/***********************************************************
   Add your main indicator loop below.  You can reference an existing
      indicator with its iName  or iCustom.
   Rule 1:  Add extern inputs above for all neccesary values
   Rule 2:  Use 'TimeFrame' for the indicator time frame
   Rule 3:  Use 'y' for your indicator's shift value
 **********************************************************/
      double totalUp = 0.0;
      double totalDown = 0.0;

      totalUp=iCustom(NULL,PERIOD_M5,"XO",KirPER,0,i);
      totalDown=iCustom(NULL,PERIOD_M5,"XO",KirPER,1,i);
      totalUp= totalUp + iCustom(NULL,PERIOD_M15,"XO",KirPER,0,p15);
      totalDown= totalDown + iCustom(NULL,PERIOD_M15,"XO",KirPER,1,p15);
      totalUp= totalUp + iCustom(NULL,PERIOD_M30,"XO",KirPER,0,p30);
      totalDown= totalDown + iCustom(NULL,PERIOD_M30,"XO",KirPER,1,p30);
      totalUp= totalUp + iCustom(NULL,PERIOD_H1,"XO",KirPER,0,p60);
      totalDown= totalDown + iCustom(NULL,PERIOD_H1,"XO",KirPER,1,p60);

      ExtMapBuffer1[i] = 0;
      ExtMapBuffer2[i] = 0;
      ExtMapBuffer3[i] = 0;
      ExtMapBuffer4[i] = 0;
      if ( totalUp == 4 || totalDown == -4 ) {
         ExtMapBuffer3[i] = totalUp;
         ExtMapBuffer4[i] = totalDown;
      } else {
         ExtMapBuffer1[i] = totalUp;
         ExtMapBuffer2[i] = totalDown;
      }
   }
   return(0);
  }
//+------------------------------------------------------------------+
Sample
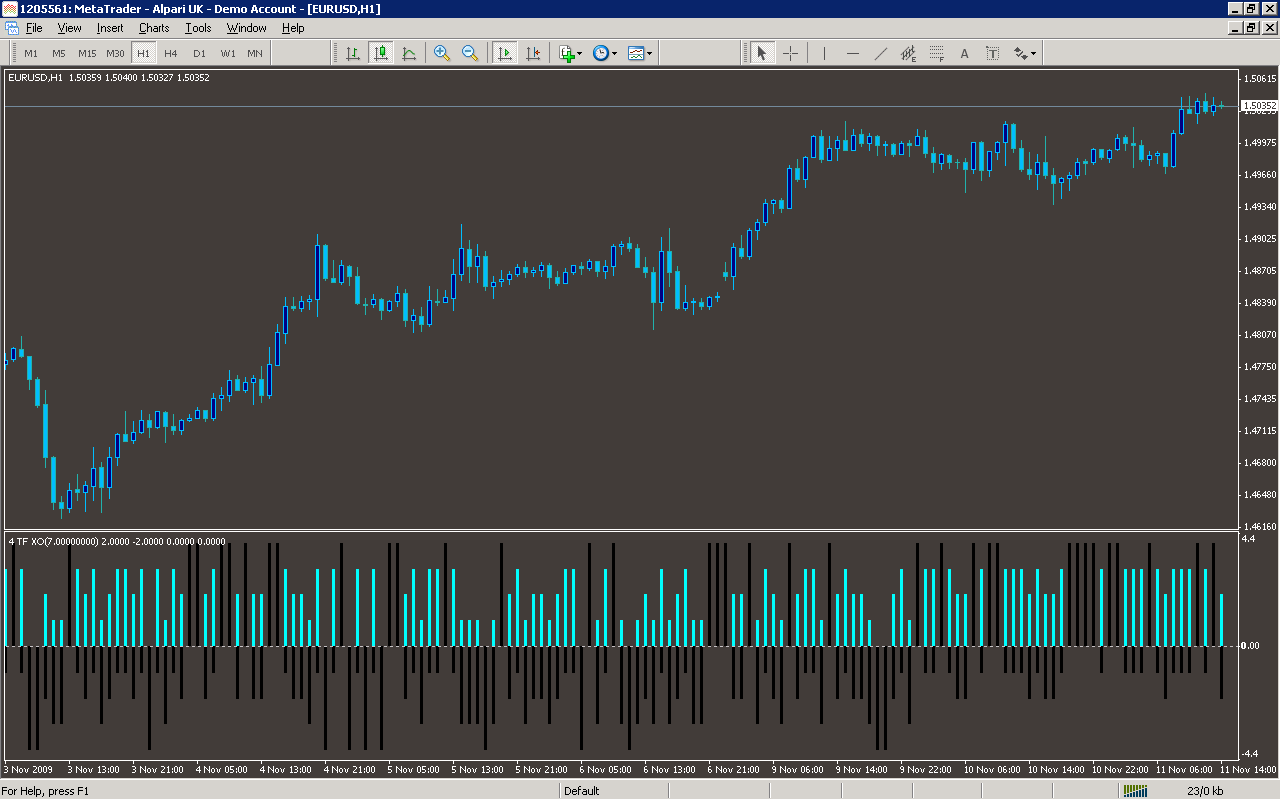
Analysis
Market Information Used:
Series array that contains open time of each bar
Indicator Curves created:
Implements a curve of type DRAW_HISTOGRAM
Indicators Used:
Custom Indicators Used:
XO
Order Management characteristics:
Other Features: