//+------------------------------------------------------------------+
//|                                                   3LineBreak.mq4 |
//|                               Copyright © 2004, Poul_Trade_Forum |
//|                                                         Aborigen |
//|                                          http://forex.kbpauk.ru/ |
//+------------------------------------------------------------------+
#property copyright "Poul Trade Forum"
#property link      "http://forex.kbpauk.ru/"
#property indicator_chart_window
#property indicator_buffers 2

//---- input parameters
extern int Lines_Break=3;
//---- buffers
double HighBuffer[];
double LowBuffer[];
double VALUE1,VALUE2,Swing=1,OLDSwing;
//+------------------------------------------------------------------+
//| Custom indicator initialization function                         |
//+------------------------------------------------------------------+
int init()
  {
   string short_name;
//---- indicator line
   SetIndexStyle(0,DRAW_HISTOGRAM,EMPTY,2,Blue);
   SetIndexStyle(1,DRAW_HISTOGRAM,EMPTY,2,Red);

   SetIndexBuffer(0,HighBuffer);
   SetIndexBuffer(1,LowBuffer);

   SetIndexEmptyValue(0,0);
   SetIndexEmptyValue(1,0);

//---- name for DataWindow and indicator subwindow label
   short_name="3LineBreak";
   IndicatorShortName(short_name);
   SetIndexLabel(0,short_name);

//----
   SetIndexDrawBegin(0,10);
   SetIndexDrawBegin(1,10);
//----

   return(0);
  }
//+------------------------------------------------------------------+
//| Custor indicator deinitialization function                       |
//+------------------------------------------------------------------+
int deinit()
  {
//---- TODO: add your code here

//----
   return(0);
  }
//+------------------------------------------------------------------+
//| Custom indicator iteration function                              |
//+------------------------------------------------------------------+
int start()
  {
   int    counted_bars=IndicatorCounted(),i,shift;


//---- TODO: add your code here
if (counted_bars==0) counted_bars=Lines_Break+1;
i=(Bars-counted_bars);

for (shift=i; shift>=0;shift--)
{

OLDSwing=Swing;

VALUE1=High[Highest(NULL,0,MODE_HIGH,Lines_Break,shift+1)];
VALUE2= Low[Lowest(NULL,0,MODE_LOW,Lines_Break,shift+1)];
if (OLDSwing==1 &&  Low[shift]<VALUE2) Swing=-1;
if (OLDSwing==-1 && High[shift]>VALUE1 ) Swing=1;

if (Swing==1)
{ HighBuffer[shift]=High[shift]; LowBuffer[shift]=Low[shift]; }

if (Swing==-1)
{ LowBuffer[shift]=High[shift]; HighBuffer[shift]=Low[shift]; }


 //----
}
   return(0);
  }
//+------------------------------------------------------------------+
Sample
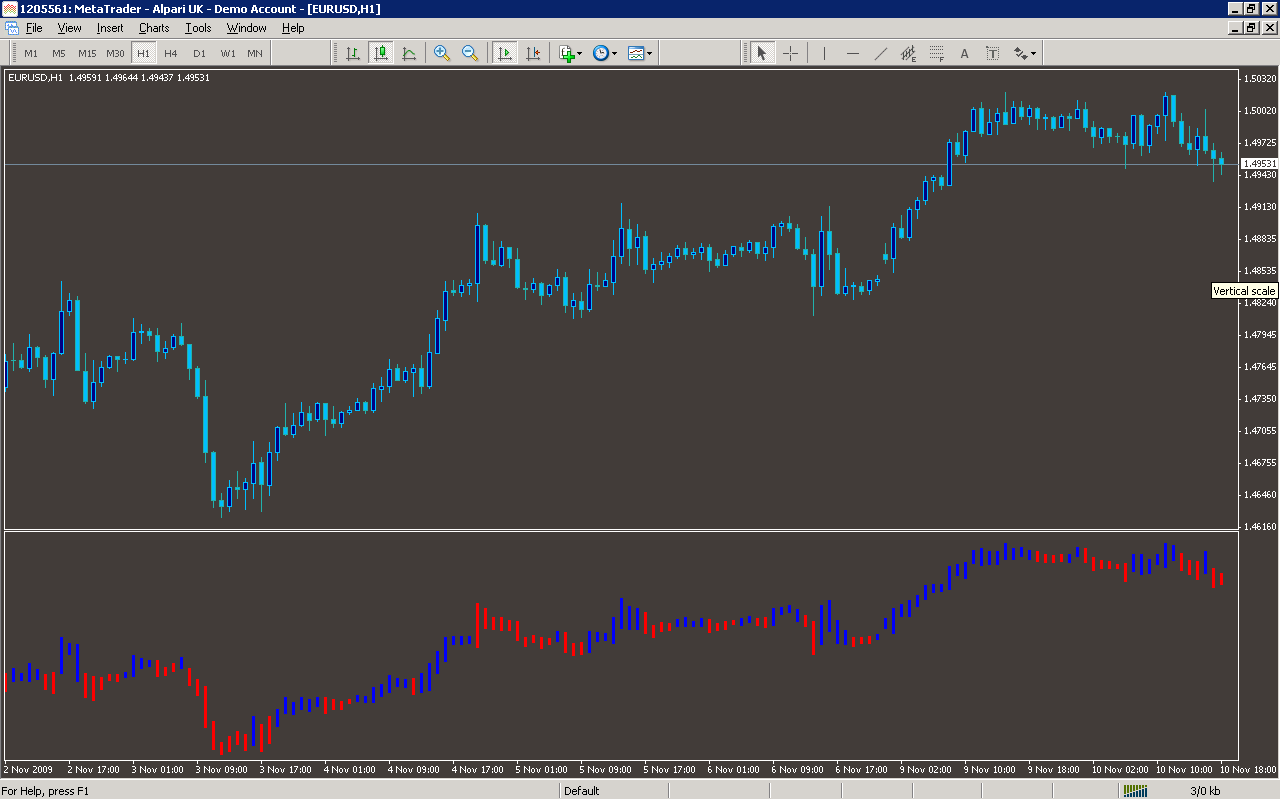
Analysis
Market Information Used:
Series array that contains the highest prices of each bar
Series array that contains the lowest prices of each bar
Indicator Curves created:
Implements a curve of type DRAW_HISTOGRAM
Indicators Used:
Custom Indicators Used:
Order Management characteristics:
Other Features: