//+------------------------------------------------------------------+
//|       AbsoluteStrength_v1DH              AbsoluteStrength_v1.mq4 |
//|                           Copyright © 2006, TrendLaboratory Ltd. |
//|            http://finance.groups.yahoo.com/group/TrendLaboratory |
//|                                       E-mail: igorad2004@list.ru |
//+------------------------------------------------------------------+
#property copyright "Copyright © 2006, TrendLaboratory Ltd."
#property link      "http://finance.groups.yahoo.com/group/TrendLaboratory"

#property indicator_separate_window
#property indicator_buffers   4
#property indicator_color1    LightBlue
#property indicator_width1    2
#property indicator_color2    Tomato
#property indicator_width2    1
#property indicator_color3    Aqua
#property indicator_width3    1
#property indicator_style3    3
#property indicator_color4    Orange
#property indicator_width4    1
#property indicator_style4    3
//---- input parameters
extern int       Mode =  0; // 0-RSI method; 1-Stoch method
extern int       Length = 10; // Period
extern int       Smooth =  5; // Period of smoothing
extern int       Signal =  5; // Period of Signal Line
extern int       Price  =  0; // Price mode : 0-Close,1-Open,2-High,3-Low,4-Median,5-Typical,6-Weighted
extern int       ModeMA =  3; // Mode of Moving Average
//---- buffers
double Bulls[];
double Bears[];
double AvgBulls[];
double AvgBears[];
double SmthBulls[];
double SmthBears[];
double SigBulls[];
double SigBears[];

//+------------------------------------------------------------------+
//| Custom indicator initialization function                         |
//+------------------------------------------------------------------+
int init()
  {
//---- indicators
   IndicatorBuffers(8);
   SetIndexStyle(0,DRAW_HISTOGRAM);
   SetIndexBuffer(0,SmthBulls);
   SetIndexStyle(1,0);
   SetIndexBuffer(1,SmthBears);
   SetIndexStyle(2,DRAW_LINE);
   SetIndexBuffer(2,SigBulls);
   SetIndexStyle(3,DRAW_LINE);
   SetIndexBuffer(3,SigBears);
   SetIndexBuffer(4,Bulls);
   SetIndexBuffer(5,Bears);
   SetIndexBuffer(6,AvgBulls);
   SetIndexBuffer(7,AvgBears);
//---- name for DataWindow and indicator subwindow label
   string short_name="AbsoluteStrength("+Mode+","+Length+","+Smooth+","+Signal+",,"+ModeMA+")";
   IndicatorShortName(short_name);
   SetIndexLabel(0,"Bulls");
   SetIndexLabel(1,"Bears");
   SetIndexLabel(2,"SignalBulls");
   SetIndexLabel(3,"SignalBears");
//----
   SetIndexDrawBegin(0,Length+Smooth+Signal);
   SetIndexDrawBegin(1,Length+Smooth+Signal);
   SetIndexDrawBegin(2,Length+Smooth+Signal);
   SetIndexDrawBegin(3,Length+Smooth+Signal);

   return(0);
  }

//+------------------------------------------------------------------+
//| Custom indicator iteration function                              |
//+------------------------------------------------------------------+
int start()
  {
   int      shift, limit, counted_bars=IndicatorCounted();
   double   Price1, Price2, smax, smin;
//----
   if ( counted_bars < 0 ) return(-1);
   if ( counted_bars ==0 ) limit=Bars-Length+Smooth+Signal-1;
   if ( counted_bars < 1 )
   for(int i=1;i<Length+Smooth+Signal;i++)
   {
   Bulls[Bars-i]=0;
   Bears[Bars-i]=0;
   AvgBulls[Bars-i]=0;
   AvgBears[Bars-i]=0;
   SmthBulls[Bars-i]=0;
   SmthBears[Bars-i]=0;
   SigBulls[Bars-i]=0;
   SigBears[Bars-i]=0;
   }


   if(counted_bars>0) limit=Bars-counted_bars;
   limit--;

   for( shift=limit; shift>=0; shift--)
      {
      Price1 = iMA(NULL,0,1,0,0,Price,shift);
      Price2 = iMA(NULL,0,1,0,0,Price,shift+1);

         if (Mode==0)
         {
         Bulls[shift] = (0.5*(MathAbs(Price1-Price2)+(Price1-Price2)))-0.5*(MathAbs(Price1-Price2)-(Price1-Price2));
         Bears[shift] = -0.5*(MathAbs(Price1-Price2)-(Price1-Price2))+0.5*(MathAbs(Price1-Price2)-(Price1-Price2));
         }

         if (Mode==1)
         {
         smax=High[Highest(NULL,0,MODE_HIGH,Length,shift)];
         smin=Low[Lowest(NULL,0,MODE_LOW,Length,shift)];

         Bulls[shift] = Price1 - smin;
         Bears[shift] = -(smax - Price1)+(smax-Price1);
         }
      }

      for( shift=limit; shift>=0; shift--)
      {
      AvgBulls[shift]=iMAOnArray(Bulls,0,Length,0,ModeMA,shift);
      AvgBears[shift]=iMAOnArray(Bears,0,Length,0,ModeMA,shift);
      }

      for( shift=limit; shift>=0; shift--)
      {
      SmthBulls[shift]=iMAOnArray(AvgBulls,0,Smooth,0,ModeMA,shift);
      SmthBears[shift]=iMAOnArray(AvgBears,0,Smooth,0,ModeMA,shift);
      }

      for( shift=limit; shift>=0; shift--)
      {
      SigBulls[shift]=iMAOnArray(SmthBulls,0,Signal,0,ModeMA,shift);
      SigBears[shift]=iMAOnArray(SmthBears,0,Signal,0,ModeMA,shift);
      }
//----
   return(0);
  }
//+------------------------------------------------------------------+
Sample
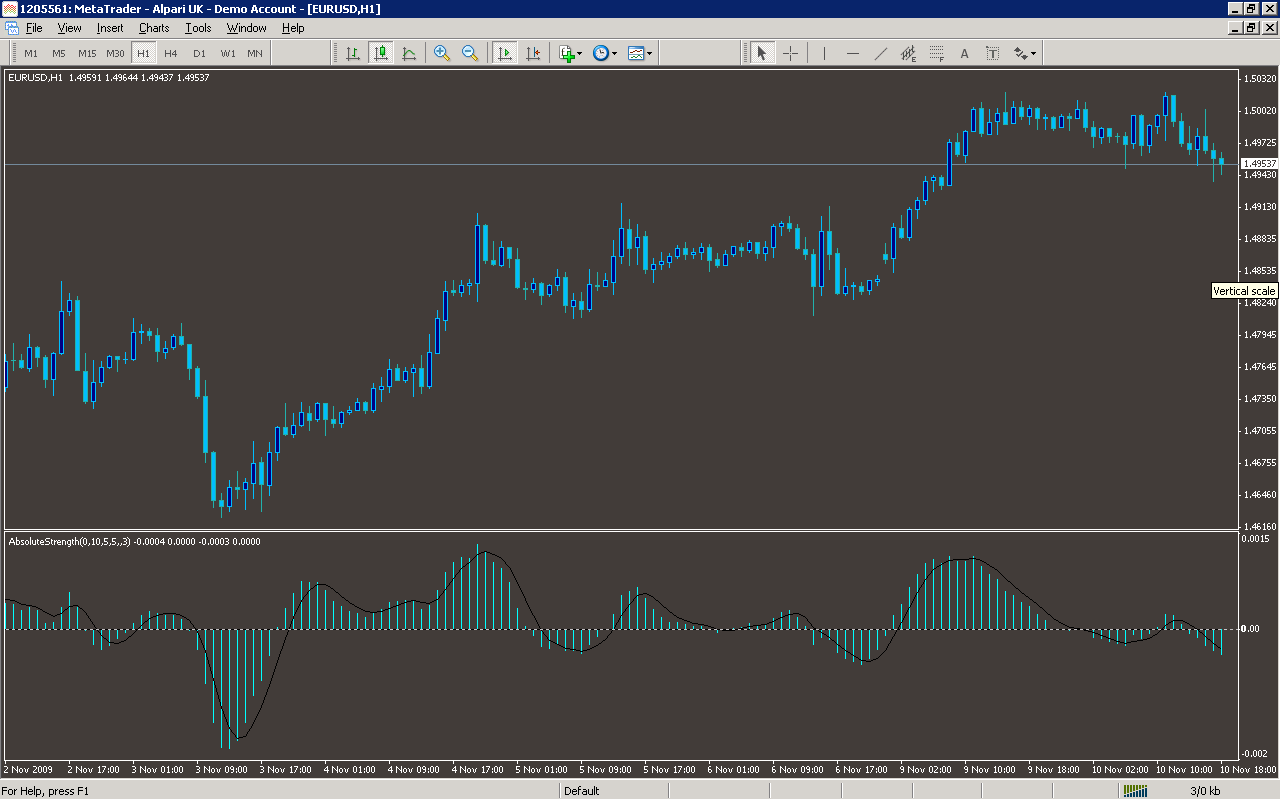
Analysis
Market Information Used:
Series array that contains the highest prices of each bar
Series array that contains the lowest prices of each bar
Indicator Curves created:
Implements a curve of type DRAW_HISTOGRAM
Implements a curve of type 0
Implements a curve of type DRAW_LINE
Indicators Used:
Moving average indicator
Custom Indicators Used:
Order Management characteristics:
Other Features: