//+------------------------------------------------------------------+
//|                                           AllPivots_v2_multi.mq4 |
//|                                                original version: |
//|                                                 AllPivots_v2.mq4 |
//|                                  Copyright © 2007, Forex-TSD.com |
//|                         Written by IgorAD,igorad2003@yahoo.co.uk |
//|            http://finance.groups.yahoo.com/group/TrendLaboratory |
//+------------------------------------------------------------------+
#property copyright "Copyright © 2009, Forex-TSD.com "
#property link      "http://www.forex-tsd.com/"

#property indicator_chart_window
#property indicator_buffers   4
#property indicator_color1    LightBlue
#property indicator_color2    Tomato
#property indicator_color3    Aqua
#property indicator_color4    Orange

extern int     CountPeriods=10;
extern string  TimePeriod="D1";
extern bool    Plot_pivots=true;
extern bool    Plot_middle=false;
extern bool    Plot_camarilla=false;
extern int     LineWidth=1;
extern string  Style_Description="//STYLE_SOLID=0, STYLE_DASH=1, STYLE_DOT=2, STYLE_DASHDOT=3, STYLE_DASHDOTDOT=4";
extern int     Style_pivots=4;
extern int     Style_middle=3;
extern int     Style_camarilla=1;

   datetime time1;
   datetime time2;
   double open,close,high,low;
   double P,R1,R2,R3,S1,S2,S3,M0,M1,M2,M3,M4,M5;
   double H1,H2,H3,H4,L1,L2,L3,L4,Range;
   double pstyle, mstyle,cstyle;
   int shift, num, period;
   string period_key;
   void ObjDel()
   {
      for (;num<=CountPeriods;num++)
      {
      ObjectDelete("PP["+num+"]"+period_key);
      ObjectDelete("R1["+num+"]"+period_key);
      ObjectDelete("R2["+num+"]"+period_key);
      ObjectDelete("R3["+num+"]"+period_key);
      ObjectDelete("S1["+num+"]"+period_key);
      ObjectDelete("S2["+num+"]"+period_key);
      ObjectDelete("S3["+num+"]"+period_key);

      ObjectDelete("M0["+num+"]"+period_key);
      ObjectDelete("M1["+num+"]"+period_key);
      ObjectDelete("M2["+num+"]"+period_key);
      ObjectDelete("M3["+num+"]"+period_key);
      ObjectDelete("M4["+num+"]"+period_key);
      ObjectDelete("M5["+num+"]"+period_key);

      ObjectDelete("H1["+num+"]"+period_key);
      ObjectDelete("H2["+num+"]"+period_key);
      ObjectDelete("H3["+num+"]"+period_key);
      ObjectDelete("H4["+num+"]"+period_key);
      ObjectDelete("L1["+num+"]"+period_key);
      ObjectDelete("L2["+num+"]"+period_key);
      ObjectDelete("L3["+num+"]"+period_key);
      ObjectDelete("L4["+num+"]"+period_key);
      }
   }

   void PlotLine(string name,double value,double line_color,int style)
   {
   ObjectCreate(name,OBJ_TREND,0,time1,value,time2,value);
   ObjectSet(name, OBJPROP_WIDTH, LineWidth);
   ObjectSet(name, OBJPROP_STYLE, style);
   ObjectSet(name, OBJPROP_RAY, false);
   ObjectSet(name, OBJPROP_BACK, true);
   ObjectSet(name, OBJPROP_COLOR, line_color);


    }
int init()
  {
   if (TimePeriod=="H1" || TimePeriod=="60") {period=PERIOD_H1; period_key="H1";}
   else
   if (TimePeriod=="H4" || TimePeriod=="240") {period=PERIOD_H4; period_key="H4";}
   else
   if (TimePeriod=="D1" || TimePeriod=="1440") {period=PERIOD_D1; period_key="D1";}
   else
   if (TimePeriod=="W1" || TimePeriod=="10080") {period=PERIOD_W1; period_key="W1";}
   else
   if (TimePeriod=="MN" || TimePeriod=="43200") {period=PERIOD_MN1; period_key="MN";}
   else
   {
   Comment("Wrong TimePeriod. Must be H1, H4, D1, W1 or MN");
   return(0);
   }
  return(0);
  }


int deinit()
  {
   ObjDel();
   Comment("");
   return(0);
  }

int start()
  {
  int i;
   Comment(indicator_color2);
  ObjDel();
  num=0;

  for (shift=CountPeriods-1;shift>=0;shift--)
  {
  time1=iTime(NULL,period,shift);

  high  = iHigh(NULL,period,shift+1);
  low   = iLow(NULL,period,shift+1);
  open  = iOpen(NULL,period,shift+1);
  close = iClose(NULL,period,shift+1);

  P  = (high+low+close)/3.0;

  R1 = 2*P-low;
  R2 = P+(high - low);
  R3 = (2*P)+(high-(2*low));

  S1 = 2*P-high;
  S2 = P-(high - low);
  S3 = (2*P)-((2*high)-low);

  M0=0.5*(S2+S3);
  M1=0.5*(S1+S2);
  M2=0.5*(P+S1);
  M3=0.5*(P+R1);
  M4=0.5*(R1+R2);
  M5=0.5*(R2+R3);

  Range = high - low;
  H4 = close + (Range * 1.1/2.0);
  H3 = close + (Range * 1.1/4.0);
  H2 = close + (Range * 1.1/6.0);
  H1 = close + (Range * 1.1/12.0);

  L1 = close - (Range * 1.1/12.0);
  L2 = close - (Range * 1.1/6.0);
  L3 = close - (Range * 1.1/4.0);
  L4 = close - (Range * 1.1/2.0);

  time2=time1+period*60;

  pstyle=Style_pivots;
  mstyle=Style_middle;
  cstyle=Style_camarilla;
  num=shift;

  PlotLine("PP["+num+"]"+period_key,P,Aqua,pstyle);
  if(Plot_pivots)
  {

   PlotLine("R1["+num+"]"+period_key,R1,Red,pstyle);
   PlotLine("R2["+num+"]"+period_key,R2,Orange,pstyle);
   PlotLine("R3["+num+"]"+period_key,R3,Gold,pstyle);

   PlotLine("S1["+num+"]"+period_key,S1,MediumSeaGreen,pstyle);
   PlotLine("S2["+num+"]"+period_key,S2,Lime,pstyle);
   PlotLine("S3["+num+"]"+period_key,S3,GreenYellow,pstyle);
  }

  if(Plot_middle)
  {
   PlotLine("M0["+num+"]"+period_key,M0,LightBlue,mstyle);
   PlotLine("M1["+num+"]"+period_key,M1,DeepSkyBlue,mstyle);
   PlotLine("M2["+num+"]"+period_key,M2,MediumSlateBlue,mstyle);
   PlotLine("M3["+num+"]"+period_key,M3,Tomato,mstyle);
   PlotLine("M4["+num+"]"+period_key,M4,Chocolate,mstyle);
   PlotLine("M5["+num+"]"+period_key,M5,Pink,mstyle);
  }

  if(Plot_camarilla)
  {
   PlotLine("H4["+num+"]"+period_key,H4,LightBlue,cstyle);
   PlotLine("H3["+num+"]"+period_key,H3,DeepSkyBlue,cstyle);
   PlotLine("H2["+num+"]"+period_key,H2,MediumSlateBlue,cstyle);
   PlotLine("H1["+num+"]"+period_key,H1,RoyalBlue,cstyle);

   PlotLine("L1["+num+"]"+period_key,L1,Chocolate,cstyle);
   PlotLine("L2["+num+"]"+period_key,L2,Orange,cstyle);
   PlotLine("L3["+num+"]"+period_key,L3,Goldenrod,cstyle);
   PlotLine("L4["+num+"]"+period_key,L4,Yellow,cstyle);
  }
  }
   return(0);
  }
//+------------------------------------------------------------------+
Sample
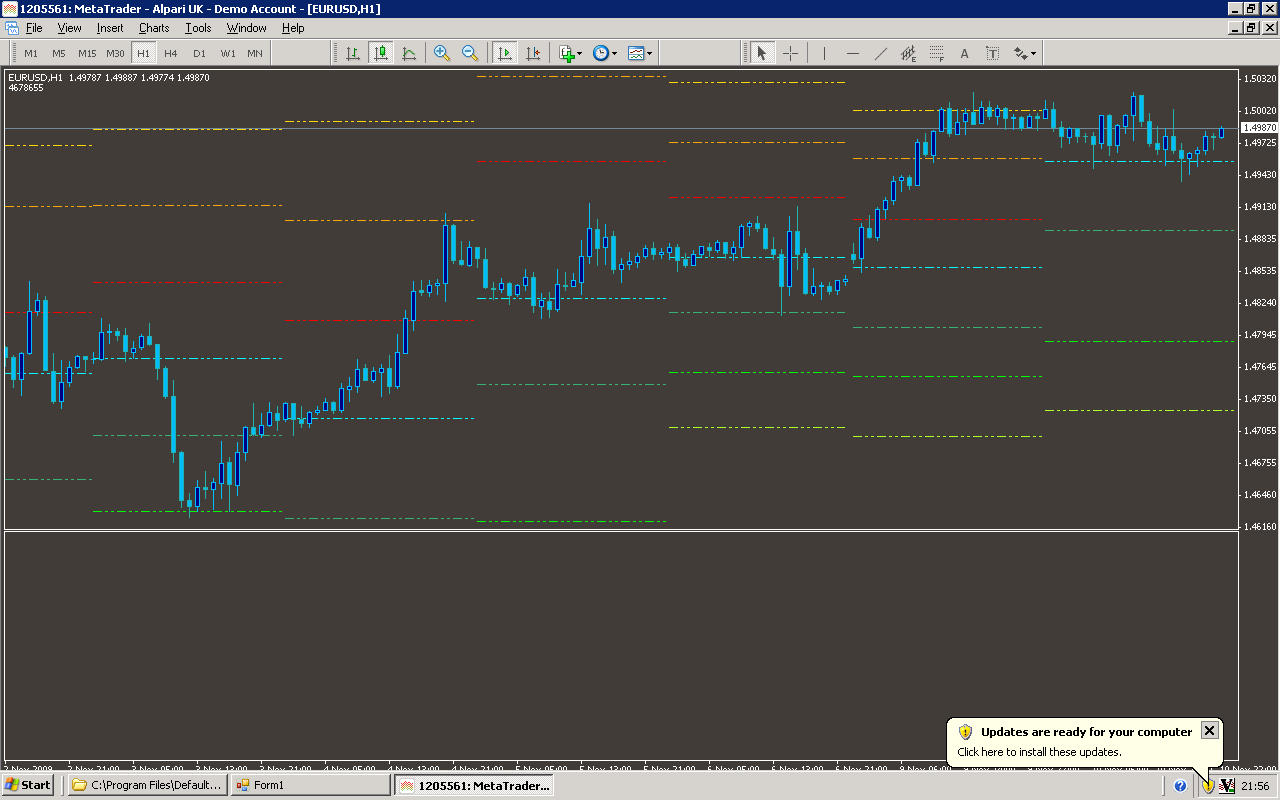
Analysis
Market Information Used:
Series array that contains the highest prices of each bar
Series array that contains the lowest prices of each bar
Series array that contains open prices of each bar
Series array that contains close prices for each bar
Indicator Curves created:
Indicators Used:
Custom Indicators Used:
Order Management characteristics:
Other Features: