//+------------------------------------------------------------------+
//|                                                          ASI.mq4 |
//|                      Copyright © 2007, MetaQuotes Software Corp. |
//|                                        http://www.metaquotes.net |
//+------------------------------------------------------------------+
#property copyright "Copyright © 2007, MetaQuotes Software Corp."
#property link      "http://www.metaquotes.net/"
//----
#property indicator_separate_window
#property indicator_buffers 1
#property indicator_color1 DarkBlue
//---- input parameters
extern double T = 300.0;
//---- buffers
double ExtMapBuffer1[];
double SIBuffer[];
//+------------------------------------------------------------------+
//| Custom indicator initialization function                         |
//+------------------------------------------------------------------+
int init()
  {
//---- indicators
   IndicatorBuffers(2);
   SetIndexStyle(0, DRAW_LINE);
   SetIndexBuffer(0, ExtMapBuffer1);
   SetIndexLabel(0, "Accumulation Swing Index");
   SetIndexBuffer(1, SIBuffer);
   SetIndexEmptyValue(0, 0.0);
   SetIndexEmptyValue(1, 0.0);
//----
   return(0);
  }
//+------------------------------------------------------------------+
//| Custom indicator deinitialization function                       |
//+------------------------------------------------------------------+
int deinit()
  {
//----
   return(0);
  }
//+------------------------------------------------------------------+
//| Custom indicator iteration function                              |
//+------------------------------------------------------------------+
int start()
  {
   int counted_bars = IndicatorCounted();
//----
   int i, limit;
   double R, K, TR, ER, SH, Tpoints;
   if(counted_bars == 0)
       limit = Bars - 1;
   if(counted_bars > 0)
       limit = Bars - counted_bars;
   Tpoints = T*MarketInfo(Symbol(), MODE_POINT);
   for(i = limit; i >= 0; i--)
     {
       TR = iATR(Symbol(), 0, 1, i);
       if(Close[i+1] >= Low[i] && Close[i+1] <= High[i])
           ER = 0;
       else
         {
           if(Close[i+1] > High[i])
               ER = MathAbs(High[i] - Close[i+1]);
           if(Close[i+1] < Low[i])
               ER = MathAbs(Low[i] - Close[i+1]);
         }
       K = MathMax(MathAbs(High[i] - Close[i+1]), MathAbs(Low[i] - Close[i+1]));
       SH = MathAbs(Close[i+1] - Open[i+1]);
       R = TR - 0.5*ER + 0.25*SH;
       if(R == 0)
           SIBuffer[i] = 0;
       else
           SIBuffer[i] = 50*(Close[i] - Close[i+1] + 0.5*(Close[i] - Open[i]) +
                         0.25*(Close[i+1] - Open[i+1]))*(K / Tpoints) / R;
       ExtMapBuffer1[i] = ExtMapBuffer1[i+1] + SIBuffer[i];
     }
//----
   return(0);
  }
//+------------------------------------------------------------------+
Sample
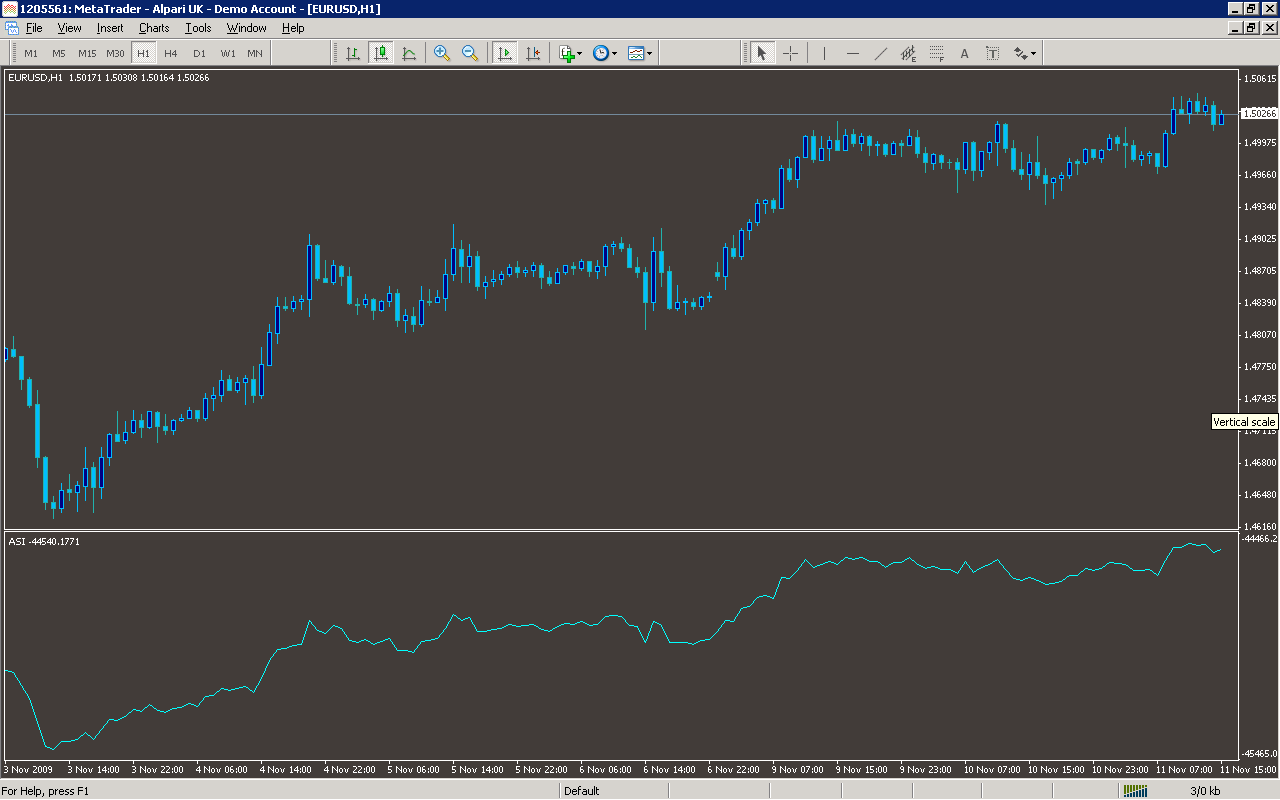
Analysis
Market Information Used:
Series array that contains close prices for each bar
Series array that contains the highest prices of each bar
Series array that contains the lowest prices of each bar
Series array that contains open prices of each bar
Indicator Curves created:
Implements a curve of type DRAW_LINE
Indicators Used:
Indicator of the average true range
Custom Indicators Used:
Order Management characteristics:
Other Features: